Electron Devices and Circuits: Unit II: (b) Junction Field Effect Transistor (JEET)
Analysis of Voltage Divider Biasing using Graphical Method
Junction Field Effect Transistor (JFET)
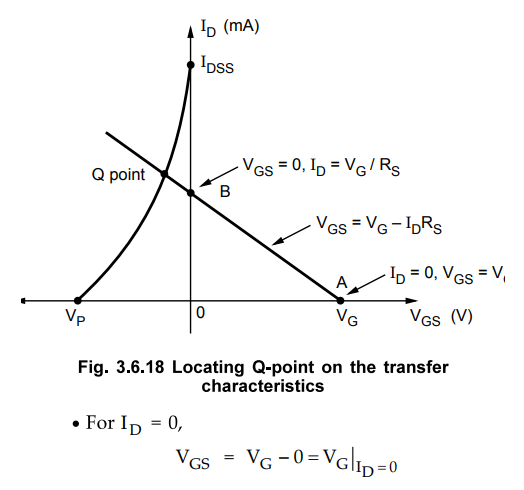
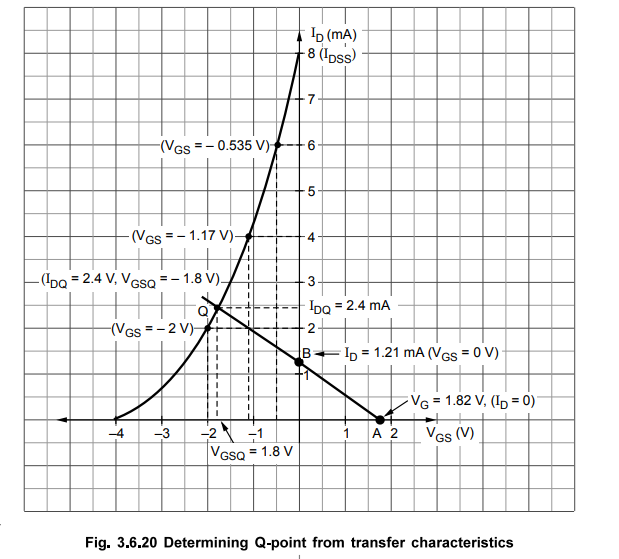
• The intersection of this straight line with the transfer curve in the region to the left of the vertical axis is the operating point (Q point).
4. Analysis of Voltage Divider Biasing using Graphical Method
•
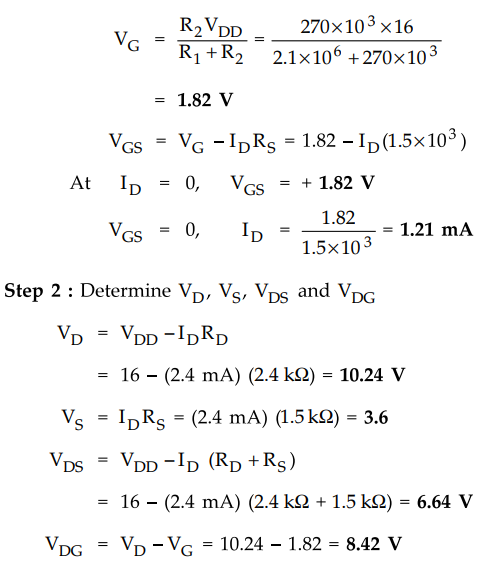
We know that, for voltage divider biasing
VS
= IDRS … (3.6.6)
and
VGS = VG - IDRS … (3.6.7)
•
These equations can be used with a transfer characteristics to find the Q
point.
•
Fig 3.6.18 shows a transfer characteristics for a voltage divider bias circuit.
•
This point is located on the transfer characteristics as a point A.
•
This point is located on the transfer characteristics as a point B.
•
The straight line between points A and B represents equation (3.6.7).
•
The intersection of this straight line with the transfer curve in the region to
the left of the vertical axis is the operating point (Q point).
Ex.
3.6.11 Determine IDQ, VGSQ VD, VDS
and VDG for the circuit shown in Fig. 3.6.19 using graphical
analysis.
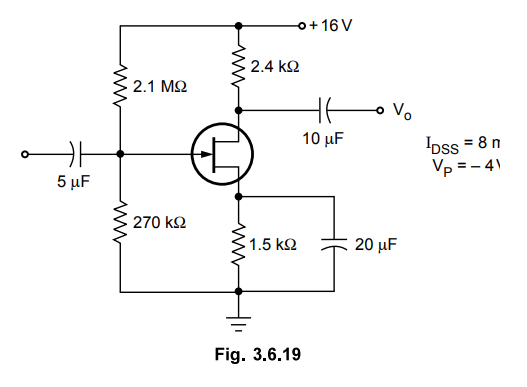
Sol.
:
Step
1 :
Draw the transfer characteristics and determine IDQ and VGSQ.
We
know that,
•
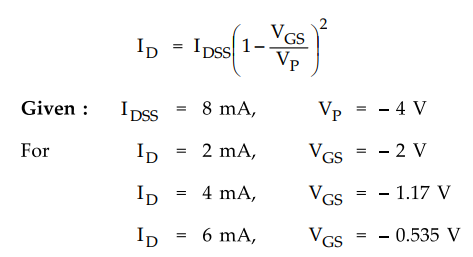
The curve representing these values obeys the Shockey’s equation in Fig. 3.6.20
Review Questions
1. Draw two different circuits that bias a JFET amplifier.
2. Draw the source self bias and voltage divider bias circuit
for FET.
3. Explain the self bias circuit for n-channel FET and give its
d.c. analysis.
4. With the help of a neat diagram explain the voltage divider
biasing method for JFET.
Electron Devices and Circuits: Unit II: (b) Junction Field Effect Transistor (JEET) : Tag: : Junction Field Effect Transistor (JFET) - Analysis of Voltage Divider Biasing using Graphical Method
Related Topics
Related Subjects
Electron Devices and Circuits
EC3301 3rd Semester EEE Dept | 2021 Regulation | 3rd Semester EEE Dept 2021 Regulation