Engineering Chemistry: Unit III: a. Phase Rule
Anna University Long Questions and Answers
Phase Rule | Engineering Chemistry
Engineering Chemistry : UNIT III : Phase Rule and Composites : Anna University long Questions & Answers
Unit - III
Chapter 3
Phase Rule
Anna University Long Questions & Answers
PART - B
1. State phase rule and explain the terms involved in it. (TNV A.U. May 2009)(A.U. June 2009, June 2014)
If the equilibrium between any number of phases is not influenced
by gravity, or electrical, or magnetic forces but is influenced only by
pressure, temperature and concentration, then the number of degree of freedom
(F) of the system is related to number of components (C) and number of phases
(P) by the following phase rule equation.
F = C – P + 2
Explanation (or) meanings of terms
(a) Phase (P)
Phase is defined as, “any homogeneous physically distinct and
mechanically separable portion of a system which is separated from other parts
of the system by definite boundaries”.
Example
Gaseous phase
All gases are completely miscible and there is no boundary between
one gas and the other.
Example
Air, which is a mixture of O2, H2, N2,
CO2 and water vapour, etc., constitutes a single phase.
(b) Component (C)
Component is defined as, “the smallest number of independently
variable constituents, by means of which the composition of each phase can be
expressed in the form of a chemical equation".
Example
Consider a water system consisting of three phases.
Ice(s) ⇌ Water(1) ⇌ Vapour(g)
The chemical composition of all the three phases is H2O,
but are in different physical form. Hence the number of component is one.
(c) Degree of freedom (F)
Degree of freedom is defined as, “the minimum number of
independent variable factors such as temperature, pressure and concentration,
which must be fixed in order to define the system completely".
Example
Consider the following equilibrium
Ice(s) ⇌ Water(l) ⇌F apour(g)
These three phases will be in equilibrium only at a particular
temperature and pressure. Hence, this system does not have any degree of
freedom, so it is non variant or zero variant.
2. Draw a neat one component water system and explain in detail. (A.U. Jan 2014, Dec 2016, May 2017)
Water exists in three possible phases namely solid, liquid and
vapour. Hence, there can be three forms of equilibria.
Solid ⇌ Liquid
Liquid ⇌ Vapour
Solid ⇌ Vapour
Each of the above equilibrium involves two phases. The phase
diagram for the water system is shown in the following figure.
This phase diagram contains curves, areas, and triple point.
(a) Curve OA
The curve OA is called vapourisation curve, it represents
the equilibrium between water and vapour. At any point on the curve the
following equilibrium will exist.
Water ⇌ Water vapour
The degree of freedom of the system is one, i.e., univariant. This
is predicted by the phase rule.
F = C – P + 2; F = 1 – 2 + 2; F = 1
This equilibrium (i.e. line OA) will extend upto the critical
temperature (374°C). Beyond the critical temperature the equilibrium will
disappear only water vapour will exist.
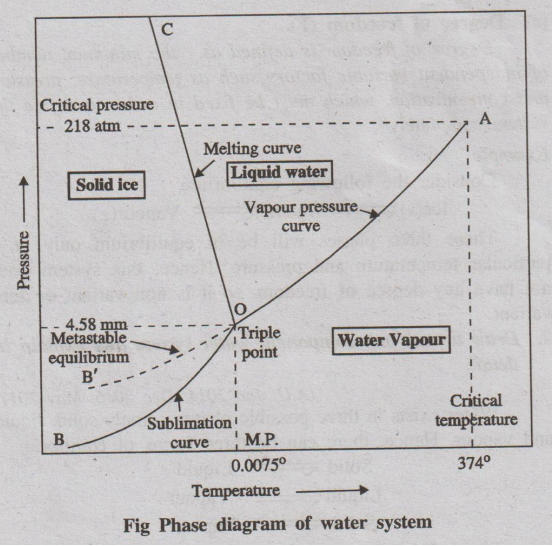
Fig Phase diagram of water system
(b) Curve OB
The curve OB is called sublimation curve of ice, it represents the
equilibrium between ice and vapour. At any point on the curve the following
equilibrium will exist.
Ice ⇌ Vapour
The degree of freedom of the system is one, i.e. univariant. This
is predicted by the phase rule.
F = C – P + 2; F = 1 – 2 + 2; F = 1
This equilibrium (line OB) will extend upto the absolute zero
(-273°C), where no vapour can be present and only ice will exist.
(c) Curve OC
The curve OC is called melting point curve of ice, it represents
the equilibrium between ice and water. At any point on the curve the following
equilibrium will exist.
Ice ⇌ water
The curve OC is slightly inclined towards pressure axis. This,
shows that melting point of ice decreases with increase of pressure.
The degree of freedom of the system is one, i.e., univariant.
(d) Point ‘O' (Triple point)
The three curves OA, OB and OC meet at a point 'O’, where three
phases namely solid, liquid and vapour are simultaneously at equilibrium.
This point is called triple point, at this point the
following equilibrium will exist.
Ice(s) ⇌ Water(1) ⇌ Vapour(g)
The degree of freedom of the system is zero i.e., nonvariant. This
is predicted by the phase rule.
F = C - P + 2; F = 1 - 3 + 2; F = 0
Temperature and pressure at the point “O' are 0.0075°C and 4.58 mm
respectively.
(e) Curve OB': (Metastable equilibrium)
The curve OB' is called vapour pressure curve of the super-cool
water or metastable equilibrium where the following equilibrium will exist.
Super-cool water ⇌ Vapour
(f) Areas
Area AOC, BOC, AOB represents water, ice and vapour respectively.
The degree of freedom of the system is two. i.e.. Bivariant.
This is predicted by the phase rule
F = C - P + 2; F = 1 - 1 + 2; F = 2
3. Draw a neat phase diagram and explain the lead-silver system?
Briefly write about Pattinson's process. (A.U.
May 2003, June 2014, Dec 2016)
Since the system is studied at constant pressure, the vapour phase
is ignored and the condensed phase rule is used.
F' = C – P + 1
The phase diagram of lead-silver system is shown in the following
figure. It contains lines, areas and the eutectic point.
(a) Curve AO
The curve AO is known as freezing point curve of silver. Point A
is the melting point of pure Ag (961°C). The curve AO shows the melting point
depression of Ag by the successive addition of Pb. Along this curve AO, solid
Ag and the melt are in equilibrium. S
olid Ag ⇌ Melt
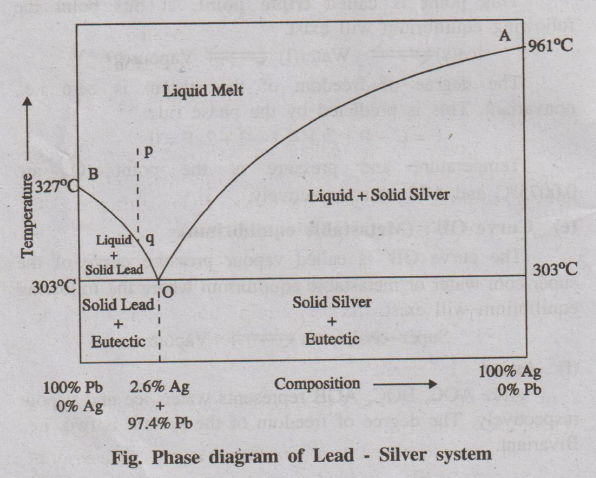
Fig. Phase diagram of Lead - Silver system
According to reduced phase rule equation.
F' = C – P + 1; F' = 2 - 2 + 1; F' = 1
The system is univariant.
(b) Curve BO
The curve BO is known as freezing point curve of lead. Point B is
the melting point of pure lead (327°C). The curve BO shows the melting point
depression of ‘Pb' by the successive addition of ‘Ag’. Along this curve ‘BO’,
solid ‘Pb' and the melt are in equilibrium.
Solid Pb ⇌ Melt
According to reduced phase rule equation.
F' = C - P +1; F' = 2 - 2 + 1; F' = 1
The system is univariant
(c) Point 'O' (Eutectic point)
The curves AO and BO meet at point 'O' at a temperature of 303°C,
where three phases (solid Ag, solid Pb and their liquid melt) are in
equilibrium.
Solid Pb + Solid Ag ⇌ Melt.
According to reduced phase rule equation.
F' = C - P + 1; F' = 2 - 3+1; F' = 0
The system is non-variant.
The point “O' is called eutectic point or eutectic temperature and
its corresponding composition, 97.4%Pb + 2.6%Ag, is called eutectic composition.
Below this point the eutectic compound and the metal solidify.
(d) Areas
The area above the line AOB has a single phase (molten Pb + Ag).
According to reduced phase rule equation.
F' = C - P + 1; F' = 2 - 1 + 1; F' = 2
The system is bivariant.
Application of Pattinson's process for the desilverisation of
Argentiferous lead
The argentiferous lead, consisting of a very small amount of
silver (say 0.1%), is heated to a temperature above its melting point, so that
the system consisting of only the liquid phase represented by the point ‘p' in
the above figure. It is then allowed to cool. The temperature falls down along
the line 'pq'. As soon as the point 'q' is reached, Pb is crystallised out and
the solution will contain relatively increasing amount of ‘Ag’. On further
cooling, more and more ‘Pb' is separated along the line ‘BO’ the melt continues
to be richer and richer in silver until the point O is reached, where the
percentage of • Ag rises to 2.6%.
Thus, the process of raising the relative proportion of Ag
in the alloy is known as Pattinson's process.
4. Mention the limitations
of phase rule. (A.U. Dec 2008)
(a) Phase rule can be applied only for the systems in equilibrium.
(b) Only three variables like P, T & C are considered, but not
electrical, magnetic and gravitational forces.
(c) All the phases of the system must be present under the same
conditions of pressure and temperature.
(d) Solid and liquid phases must not be in finely divided state,
otherwise deviations occur.
5. What is condensed phase rule? What is the number of degrees of
freedom at the eutectic point for a two component system? (AU. May 2003, June 2006)
A solid-liquid equilibrium of an alloy has practically no gaseous
phase and the effect of pressure is negligible. Therefore, experiments are
conducted under atmospheric pressure. Thus the system in which only the solid
and liquid phases are considered and the gas phase is ignored is called a condensed
system. Since the pressure is kept constant, the phase rule becomes
F' = C – P + 1.
This equation is called reduced phase rule or condensed phase
rule.
Example
Consider a two component solid Pb - solid Ag system, the following
equilibrium will exist at eutectic point “0’
Solid Pb + Solid Ag ⇌ melt
Number of Phases = 3
Number of components = 2
:: F' = C – P + 1
= 2 - 3 + 1
F' = 0
Number of degree of freedom = 0 (zero)
6. What is thermal analysis. Draw the cooling curves of a pure
substance and a mixture and discuss. (AU.
June 2006)
Thermal analysis is a method involving a study of the cooling
curves of various compositions of a system during solidification. The shapes of
the freezing point curves for any system (involving metals) can be determined
by thermal analysis. The form of the cooling curve indicates the composition of
the solid.
Example - 1 Cooling curve for a pure solid
A pure substance in the fused state is allowed to cool slowly and
the temperature is noted at different time interval. Then graph is plotted
between temperature and time (Fig.(a)).
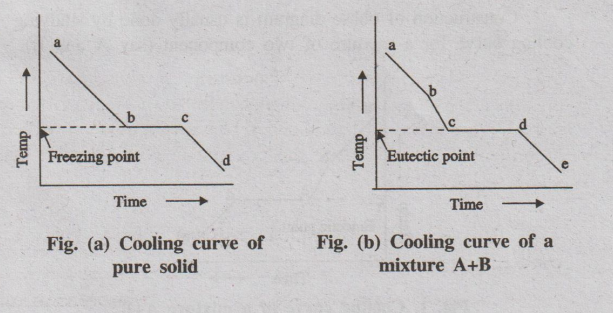
Fig. (a) Cooling curve of
Fig. (b) Cooling curve of a
Initially the rate of cooling is continuous. When it reaches the
point ‘b'solid begins to appear, now the temperature remains constant until the
liquid melt is completely solidified. Solidification completes at the point
'c'. The horizontal line ‘bc' represents the equilibrium between the solid and
liquid melt. After the point 'c', temperature of the solid begins to decrease
along the curve 'cd'.
Example - 2 Cooling curve for a mixture
If a mixture of two substances (say A and B) in the fused state is
allowed to cool slowly, the cooling curve is obtained in a similar manner (Fig.
(b)).
Initially the rate of cooling is continuous. When it reaches the
point b'one substance (either A or B) begins to solidify out of the melt, which
is indicated by a break and the rate of cooling is different. On further
cooling at the break point ‘c'the second compound also begins to solidify. Now
the temperature remains constant until the liquid melt is completely
solidified, which forms the eutectic mixture (line cd). After the break point
d' cooling of solid mass begins. The temperature of horizontal line 'cd' gives
the eutectic temperature.
7. Explain the construction of phase diagram with neat sketch.
Construction of phase diagram is usually done by studying cooling
curve for a mixture of two component (say A and B).
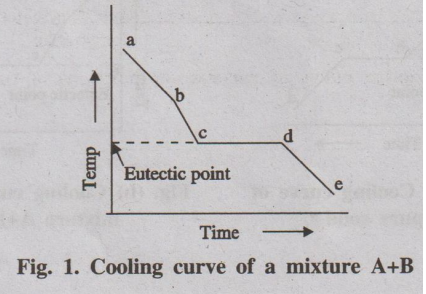
Fig. 1. Cooling curve of a mixture A+B
If a mixture of two substances (say A and B) in the fused state is
allowed to cool slowly, the cooling curve is obtained in a similar manner (Fig.
1).
Initially the rate of cooling is continuous. When it reaches the
point 'b' one substance (either A or B) begins to solidify out of the melt,
which is indicated by a break and the rate of cooling is different. On further
cooling at the break point 'c' the second compound also begins to solidify. Now
the temperature remains constant until the liquid melt is completely
solidified, which forms the eutectic mixture (line cd). After the break point
d' cooling of solid mass begins. The temperature of horizontal line 'cd' gives
the eutectic temperature.
The experiment is repeated for different compositions of A and B
and the various cooling curves are recorded. From the cooling curves of various
compositions, the main phase diagram can be drawn by taking composition in
X-axis and the temperature in Y-axis. (Fig. 2)
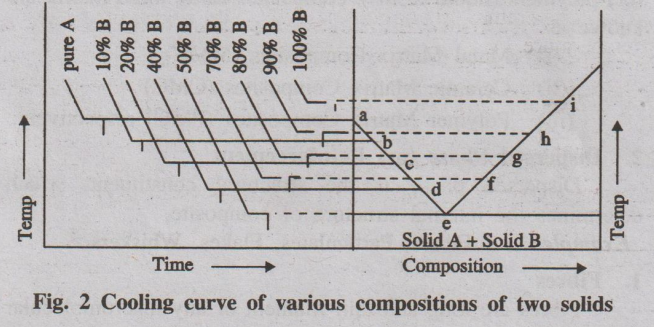
Fig. 2 Cooling curve of various compositions of two solids
Engineering Chemistry: Unit III: a. Phase Rule : Tag: Engineering Chemistry : Phase Rule | Engineering Chemistry - Anna University Long Questions and Answers
Related Topics
Related Subjects
Engineering Chemistry
CY3151 1st Semester | 2021 Regulation | 1st Semester Common to all Dept 2021 Regulation