Electrical Machines: Unit I: a. Magnetic Circuits and Electromagnetism
B -H Curve or Magnetization Curve
Key Point : The graph between the flux density (B) and the magnetic field strength (H) for the magnetic material is called as its magnetization curve or B-H curve.
B -H
Curve or Magnetization Curve
AU:
May-10, Dec.-10
•
We have already seen that magnetic field strength H is NI/l. As current in coil
changes, magnetic field strength also changes. Due to this flux produced and
hence the flux density also changes. So there exists a particular relationship
between B and H for a material which can be shown on the graph.
Key Point :
The graph between the flux density (B) and the magnetic field strength (H) for
the magnetic material is called as its magnetization curve or B-H curve.
•
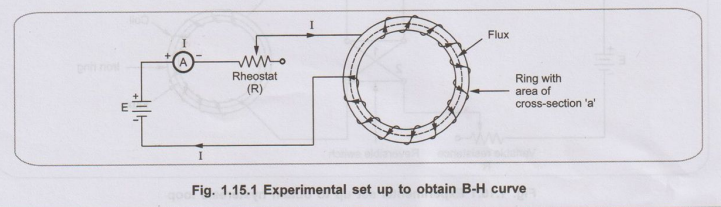
Let us obtain the B-H curve experimentally for a magnetic material. The
arrangement required is shown in the Fig. 1.15.1.
•
The ring specimen as a mean length of 'l metres with a cross-sectional area of
'a' square metres. Coil is wound for 'N' turns carrying a current 'l' which can
be varied by changing the variable resistance 'R' connected in series. Ammeter
is connected to measure the current. For measurement of flux produced,
fluxmeter can be used which is not shown in the Fig. 1.15.1.
•
So H can be calculated as NI/l while B can be calculated as ϕ/a for various
values of current and plotted. With the help of resistance R, I can be
changed from zero to maximum possible value.
The
B-H curve takes the following form, as shown in the Fig. 1.15.2.
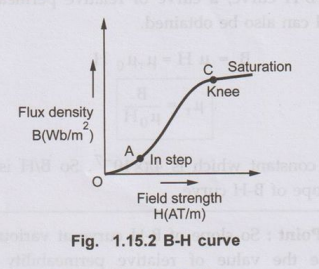
The
graph can be analysed as below :
i) Initial portion :
Near the origin for low values of 'H', the flux density does not increase
rapidly. This is represented by curve OA. The point A is called as instep.
ii) Middle portion :
In this portion as 'H' increases, the flux density B increases rapidly. This is
almost straight line curve. At point 'C' it starts bending again. The point 'C'
where this portion bends is called as knee point.
iii) Saturation portion : After
the knee point, rate of increase in 'B' reduces drastically. Finally the curve
becomes parallel to 'X' axis indicating that any increase in 'H' hereafter is
not going to cause any change in 'B'. The ring is said to be saturated and
region as saturation region. We have seen already that according to
molecular theory of magnetism, when all molecular magnets align themselves in
the same direction due to application of H, saturation occurs.
Such
curves are also called saturation curves.
1. B-H Curve and Permeability
From B-H curve, a curve of relative
permeability up and H can also be obtained.
As
B = µ H = µr µ0 H
ஃ µr = B/ µ0
H
µ0
is constant which is 4πx10-7. So B/H is nothing but slope of B-H
curve.
Key Point :
So slope of B-H curve at various points decide the value of relative
permeability at that point.
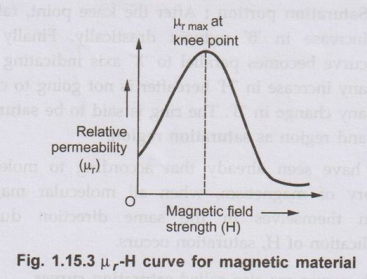
•
Initially the slope is low so value of µr is also low. At knee
point, the value of slope of B-H curve is maximum and hence µr is
maximum. But in saturation region the value of µr maximum and hence
µr is maximum. But in saturation region the value of ur falls down
to very low value as slope of B-H curve in saturation region is almost zero.
•
The curve of us against H is shown in the Fig. 1.15.3 for a magnetic material.
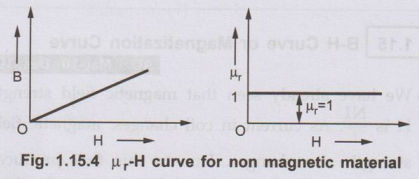
•
The value of µr is 1 which is
constant in case of non magnetic material. The slope of B-H curve is constant
i.e. it is a straight line passing through the origin as shown in the Fig.
1.15.4.
2. Practical use of B-H Curves
• While designing the magnetic circuits,
magnetization curves are useful to design the values of B corresponding to H.
From this, proper material with required relative permeability can be selected.
•
The various materials like iron, steel are generally represented by the B-H
curves and µr -H curves.
Review Questions
1. Draw the B-H curve
and discuss in detail the B-H relationship. AU : May-10, Dec.-10, Marks 8
2. Explain the
practical use of B-H curve.
Electrical Machines: Unit I: a. Magnetic Circuits and Electromagnetism : Tag: : - B -H Curve or Magnetization Curve
Related Topics
Related Subjects

Electrical Machines I
EE3303 EM 1 3rd Semester EEE Dept | 2021 Regulation | 3rd Semester EEE Dept 2021 Regulation