Electrical Machines II: UNIT III: b. Circle Diagram
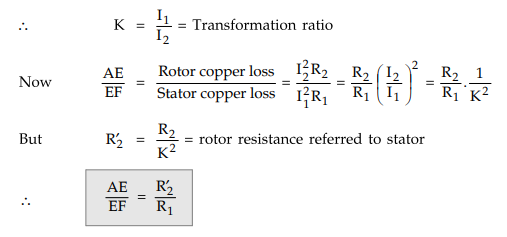
Construction of the Circle Diagram
Induction Motor
By using the data obtained from the no load test and the blocked rotor test, the circle diagram can be drawn using the following steps
Construction of the Circle Diagram AU : May-07, 14, 16,
17, Nov.-04, Dec.-04, 05, 13
By
using the data obtained from the no load test and the blocked rotor test, the
circle diagram can be drawn using the following steps :
Step
1 :
Take reference phasor V as vertical (Y-axis).
Step
2 :
Select suitable current scale such that diameter of circle is about 20 to 30
cm.
Step
3 :
From no load test, Io and ϕo are obtained. Draw vector Io,
lagging V by angle ϕo. This is line ∞ ' as shown in the Fig. 6.5.1.

Step
4 :
Draw horizontal line through extremity of Io i.e. O', parallel to
horizontal axis.
Step
5 :
Draw the current ISN calculated from Isc with the same scale, lagging V by angle
ϕsc, from the origin O. This is phasor OA as shown in the Fig.
6.5.1.
Step
6 :
Join O'A. the line O'A is called Output line.
Step
7 :
Draw a perpendicular bisector of O'A. Extend it to meet line OT5 at point C.
This is the centre of the circle.
Step
8 :
Draw the circle, with C as a centre and radius equal to O'C. This meets the
horizontal line drawn from O' at B as shown in the Fig. 6.5.1.
Step
9 :
Draw the perpendicular from point A on the horizontal axis, to meet OT5 line at
F and meet horizontal axis at D.
Step
10 :
Torque line
The
torque line separates stator and rotor copper losses.
Note
that as voltage axis is vertical, all the vertical distances are proportional
to active components of currents or power inputs, if measured at appropriate
scale.
Thus
the vertical distance AD represents power input at short circuit i.e. WSN,
which consists of core loss and stator, rotor copper losses.
Now
FD = O’G = fixed loss
where
O'G is drawn perpendicular from O' on horizontal axis. This represents power
input on no load i.e. fixed loss.
Hence
AF ∝ sum of stator and
rotor copper losses
Then
point E can be located as,
AE
/ EF = rotor copper loss / stator copper loss
The
line OTi under this condition is called torque line.
Power
scale : As AD represents WSN i.e. power input
on short circuit at normal voltage, the power scale can be obtained as,
Power
scale = WSN / l(AD) W/cm
where
l(AD) - Distance AD in cm
Location
of Point E : In a slip ring induction motor, the
stator resistance per phase R1 and rotor resistance per phase R2
can be easily measured. Similarly by introducing ammeters in stator and rotor
circuit, the currents I1 and I2 also can be measured.
Thus
point E can be obtained by dividing line AF in the ratio R2 to Rr
In
a squirrel cage motor, the stator resistance can be measured by
conducting resistance test.
Stator
copper loss = 3 I2SN R1 where I SN
is phase value
Neglecting
core loss, WSN = Stator Cu loss + Rotor Cu loss
Rotor copper loss = WSN - 3 I2SN R1

Dividing
line AF in this ratio, the point E can be obtained and hence OT! represents
torque line.
1. Predicting Performance from Circle Diagram
Let
motor is running by taking a current OP as shown in the Fig. 6.5.1. The various
performance parameters can be obtained from the circle diagram at that load
condition.
Draw
perpendicular from point P to meet output line at Q, torque line at R, the base
line at S and horizontal axis at T.
We
know the power scale as obtained earlier.
Using
the power scale and various distances, the values of the performance
parameters
can be obtained as,
1.
Total motor input = PT × Power scale
2.
Fixed loss = ST × Power scale
3.
Stator copper los = SR × Power scale
4.
Rotor copper loss = QR × Power scale
5.
Total loss = QT × Power scale
6.
Rotor output = PQ × Power scale
7.
Rotor input = PQ + QR = PR × Power scale
8.
Slip s = Rotor Cu loss / Rotor input = QR / PR
9.
Power factor cos ϕ = PT / OP
10.
Motor efficiency = Output / Input = PQ /
PT
11.
Rotor efficiency = Rotor output / Rotor input = PQ / PR
12.
Rotor output / Rotor input = 1 - s
= N/Ns = PQ / PR
The
torque is the rotor input in synchronous watts.
2. Maximum Quantities
The
maximum values of various parameters can also be obtained by using circle
diagram.
1.
Maximum Output : Draw a line parallel to O'A and is also
tangent to the circle at point M. The point M can also be obtained by extending
the perpendicular drawn from C on OA. to meet the circle at M. Then the maximum
output is given by Z(MN) at the power scale. This is shown in the Fig. 6.5.1.
2.
Maximum Input : It occurs at the highest point on the
circle i.e. at point L. At this point, tangent to the circle is horizontal. The
maximum input is given Z(LL') at the power scale.
3.
Maximum Torque : Draw a line parallel to the torque line
and is also tangent to the circle at point J. The point J can also be obtained
by drawing perpendicular from C on torque line and extending it to meet circle
at point J. The Z(JK) represents maximum torque in synchronous watts at the
power scale. This torque is also called stalling torque or pull out
torque.
4.
Maximum Power Factor : Draw a line tangent to the circle
from the origin O, meeting circle at point H. Draw a perpendicular from H on
horizontal axis till it meets it at point I. Then angle OHI gives angle
corresponding to maximum power factor angle.
Maximum
p.f. = cos [∠
OHI] = HI / OH
5.
Starting Torque : The torque is proportional to the rotor
input. At s = 1, rotor input is equal to rotor copper loss i.e. l(AE).
Tstart
= l(AE) × Power scale … In synchronous watts
3. Full Load Condition
The
full load motor output given on the name plates in watts or h.p. Calculate the
distance corresponding to the full load output using the power scale.
Then
extend AD upwards from A onwards, equal to the distance corresponding to full
load output, say ADraw parallel to the output line O'A from A' to meet the
circle at point P'. This is the point corresponding to the full load condition,
as shown in the Fig. 6.5.2.

Once
point P' is known, the other performance parameters can be obtained easily as
discussed above.
Example
6.5.1 A 415 V, 29.84 kW, 50 Hz delta connected motor gave
the following test data :
No
load test : 415 V, 21 A, 1250 W. Locked rotor test : 100 V, 45 A, 2730 W.
Construct the circle diagram and determine the line current and power factor
for rated output, and the maximum torque. Assume stator and rotor Cu losses
equal at stand still. AU : May-07, Marks 12
Solution
:
From no load test,

Choose
current scale to be 1 cm = 10 A
1)
Draw vector OO = Io = 21 A i.e. 2.1 cm with ϕo = 85.25°
measured from voltage axis i.e. Y-axis.
2)
Draw horizontal line from O' parallel to X-axis.
3)
Draw vector OA = ISN - 186.75 A , i.e.18.67 cm at ϕSC =
69.49° from voltage axis.
4)
Join O'A, this is output line.
5)
Draw perpendicular bisector of O'A to meet the horizontal line drawn from O' at
C. This is centre of the circle.
6)
With C as a centre and CO' as radius, draw a semicircle to meet horizontal line
from O' at B, as shown in the Fig. 6.5.3.
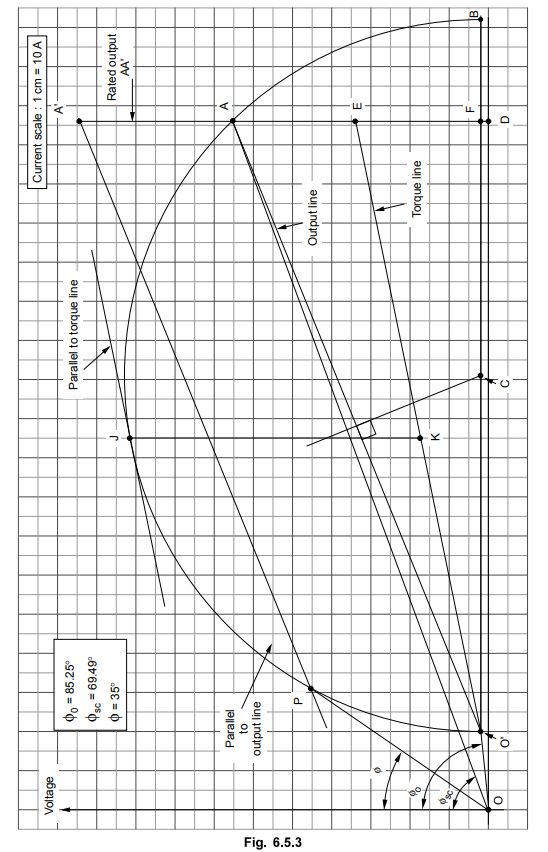
7)
Draw perpendicular from A on X-axis to meet at point D.

8)
As the stator and rotor copper losses are equal, E point is midpoint of AF i.e.
AE = AF.
Join
CTE, this is torque line.
9)
To locate full load point, draw AA' such that

10) Draw the parallel line to the output line
from O' to meet the circle at P. This is full load point for rated output.
l(OP)
= rated line current = 5.7 cm from graph
=
57 A (phase value as delta connected)
IL
= √3×57 = 98.7268 A
ϕ
= 35°
cos
ϕ = rated power factor = 0.819 lagging
For
maximum torque, draw parallel to torque line and tangent to the circle at J.
Draw
JK
vertical till torque line.
l(J
K) = 7.5 cm = Maximum torque in syn. watts
At
the power scale,
Tmax
= 7.5 × 7289.45 = 54670.87 syn. watts
Example
6.5.2 A 4.5 kW, 400 V, 50 Hz, 3 phase delta connected
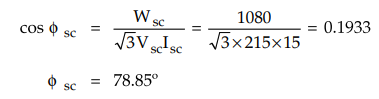
induction motor gave the following test results.
No
load : 400 V, 4.2 A, 480 W
Blocked
rotor test : 215 V, 15 A, 1080 W
The
ratio of stator to rotor resistance referred to stator is 2 : 1. Calculate the
torque, line current, power factor and efficiency at 125 % of full load.
Solution
:
From
no load test,
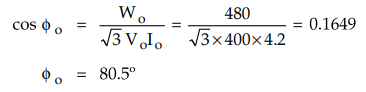
From
blocked rotor test,
As motor is delta connected, per phase current is 1/ √3 times line value.

Choose
current scale 1 cm = 1 A
Io(phase)
= 4.2 / √3 = 2.424 A = 2.424 cm
Draw
the circle diagram by usual method as shown in the Fig. 6.5.4
From
circle diagram, l(AD) = 3.55 cm = WSN

Hence
point E is between A and F such that,
Stator
copper loss / Rotor copper loss = EF /
AE = R1 / R2 = 2/1
From
circle diagram, Z(AF) = 3.25 cm
AF
= AE + EF = AE + 2 AE
AE
= 'AF / 3 = 1.0833 cm, EF = 2.166 cm
For
125 % of full load :
1.25xFullloadoutput
= 1.25 × 4.5 = 5.625 kW
As
per power scale, locate A' above A at a distance,
AA’
= 5.625 × 10³ / 1053 . 024 = 5.3417 cm
Draw
a line parallel to ouput line till it intersects the circle at P. Draw vertical
line from P to intersect output line at Q, torque line at R, base line at S and
X-axis at T.
From
circle diagram, as shown in the Fig. 6.5.4.

l(PQ)
= 5.35 cm, l(QR) = 0.3 cm, l (RS) = 0.58 cm, l (PT) = 6.55
cm, l (OP) = 8.85 cm
i)
Line current = √3 × l(OP) ×
Current scale = 15.3286 A
ii)
cos ϕ = cos(41°) = 0.7547 lagging
iii)
% ƞ = Output / Input × 100 = pQ / PT × 100 = 5.35 / 6.55 × 100 = 81.68 %
Example
6.5.3 The following data refers to a 10-pole, 400 V, 50
Hz, 3 phase induction motor :
R1
= 1.75 Ω, X1 =5.5 Ω, R2 = 2.25 Ω, X2 = 6.6 Ω.
When the motor is tested on no-load, it is observed that it takes 3.8 A (line
current) and the total core loss is 310 W. By using an approximate equivalent
circuit at 4% slip, calculate :
-
the rotor current - supply current and
power factor
-
mechanical power developed - gross load torque Also determine the equivalent
circuit.
Solution
:
I0
= 3.8 A, s = 4%, Wo = 310 W, P = 10, VL = 400 V
Assuming
star connection,

Example
6.5.4 A 3-phase, 4-pole, 60 kW, 50 Hz induction motor
connected to rated supply voltage and running without additional load consumes
3 kW. When prevented from rotating it draws rated current at 30 % rated supply
and takes a power input of 4 kW. Assuming that under rated load conditions, The
stator and rotor copper losses are equal and that the mechanical losses are 30
% of the no-load losses, determine slip, at rated load.
Solution
:
PNL
= No load input = 3 kW
PBL
= Power input when rotor blocked = 4 kW
Mechanical
loss = 30 % PNL = 0.3 × 3 = 0.9 kW
On
no load, input current is very small hence stator copper loss is negligible.
PNL
= Stator iron loss + Mechanical loss
Stator
iron loss = 3 × 10³ -0.9 × 103 = 2100 W = 2.1 kW = Pi
When
rotor is blocked and prevented from rotating,
VBL
= 30 % of V = 0.3 V
(Stator
iron loss = Pi ) ∝ V

Pi
BL = Stator iron loss for rotor blocked = 630 W
PBL
= PiBL + Stator copper loss + Rotor copper loss
But
at rated load current, Stator cu loss = Rotor cu loss (given)
4
× 103 = 630 +
2 stator cu loss
Stator
cu loss = 1685 W
Pc
= Rotor cu loss = 1685 W
Pm
= Pout + Mechanical loss
… Pout = 60 kW
Pm
= 60 × 103 + 0.9 × 103 = 60.9 kW
Now
P2 : Pc : Pm is 1 : s : 1 – s
Pc
/ Pm = s / 1 – s i.e. 1685 / 60 × 103 = s / 1 - s
s = 0.027 i.e. 2.7 % … At full load
Example
6.5.5 A 10 kW, 420 V, 3-phase, 4-pole, 50 Hz delta connected squirrel cage induction motor gave
the following data on blocked rotor test : 210 V, 20 A, 5 kW stator core loss
at rated voltage and frequency is 300 walts. The d.c. resistance measured
between any two terminals of stator is 0.6 ohm. Determine the starting torque.
Solution
:
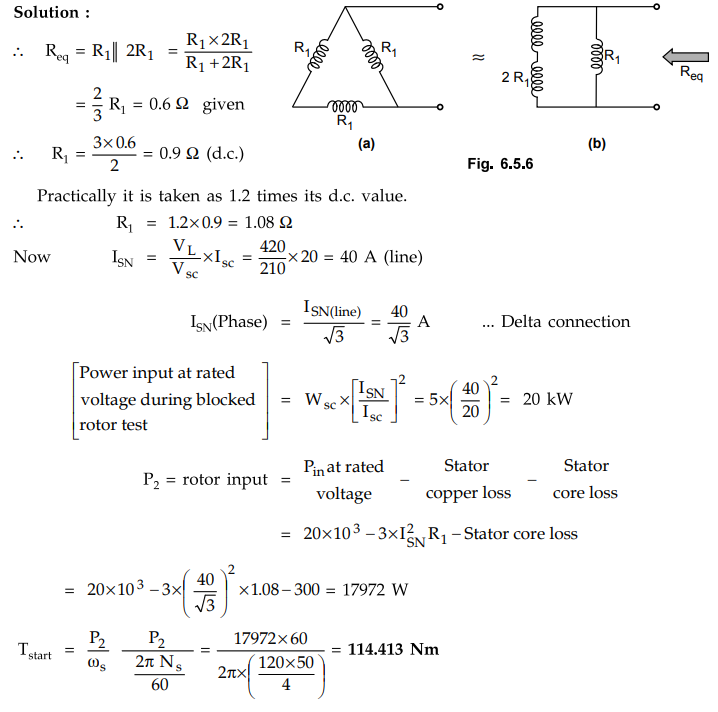
Example
6.5.6 Draw the circle diagram of a 15 hp, 230 V, 50 Hz,
3-phase slip-ring induction motor with a star connected stator and rotor. The
winding ratio is unity. The stator resistance is 0.42 Ω/ptose and the rotor
resistance is 0.3 Ω/phase. The following are the test
readings,
No
load test : 230 V, 9 A, p.f. = 0.2143
Blocked
rotor test : 115 V, 45 A, p.f. = 0.454
Find
: i) Starting torque ii) Maximum torque iii) Maximum power factor iv) Slip for
maximum torque v) Maximum power output.
Solution
:
From
no load test, cos ϕ0 = 0.2143, 0 = 77.62°
From
blocked rotor test, cos ϕsc = 0.454, ϕsc = 63°
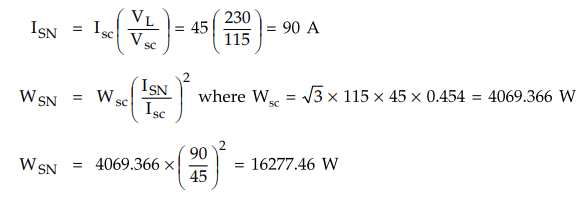
Choose
the current scale to be 1 cm = 7 A
1.
Draw OO' - Io = 9 A i.e. 1.28 cm at ϕ0 77.62° from Y-axis.
2.
Draw O’A - ISN - 90 A i.e. 12.85 cm at ϕsc = 63° from
Y-axis.
3.
Join O'A, which is output line.
4.
Draw perpendicular bisector of O'A to meet horizontal line from O' at C. This
is the centre of the circle.
5.
Draw circle with radius O'C and C as a centre to meet horizontal line from O'
at B, as shown in the Fig. 6.5.7.

6.
Draw perpendicular from A on X-axis, at point D.
l(AD)
= 5.95 cm = WSN
Power
scale = WSN / l(AD) = 16277. 46 / 5.95 = 2735.707 W/cm
7.
To locate point E, use the relation

AE
= 0.4167 AF and from graph l(AF) = 5.7 cm
AE
= 2.37 cm, EF - 3.33 cm
8.
Join O’E which is torque line.
i)
Starting torque = AE = 2.37 cm i.e. 2.37 × 2735.707
=
6483.62 syn-watts
ii)
For maximum torque, draw line parallel to the torque line (OT) which is tangent
to circle at J. Draw a vertical line from J to meet torque line at K.
l
(JK) = Tm = 4.8 cm = 4.8 × 2735.707 = 13131.39 syn-watts
iii)
Draw a line tangent to the circle from O, meeting circle at H. The angle made
by OH with Y axis is (|> m and maximum power factor is cos ϕm.
m
= 31° hence maximum p.f. = cos ϕm = 0.857 lagging
iv)
Slip for maximum torque = LK / JK = 1.1 / 4.8 = 0.229 i.e. 22.91%
v)
Extend perpendicular bisector of O'A to meet the circle at M. Draw vertical
from M to meet the output line at N then Z(MN) = Maximum output.
Maximum
output = l(MN) = 3.9 cm
=
3.9 × 2735.707 = 10.6692 kW
Example
6.5.7 A 15 kW, 400 V, 50 Hz, 3 phase star connected
induction motor gave the following test results :
No
load test : 400 V, 9 A, 1310 W
Blocked
rotor test : 200 V, 50 A, 7100 W
Stator
and rotor ohmic losses at standstill are assumed equal.
Draw
the induction motor circle diagram and calculate
i)
Line current ii) Power factor iii) Slip iv) Torque and efficiency at full load AU
: May-14, Marks 16
Solution
:
From
no load test,

Choose
the current scale to be 1 cm = 5 A.
1.
Draw vector OO' = Io = 9 A i.e. 1.8 cm at ϕo = 77.47°
from voltage axis.
2.
Draw horizontal line from O' parallel to X-axis.
3.
Draw vector OA = ISN = 100 A i.e. 20 cm at ϕsc = 65.80°
from voltage axis.
4.
Join O'A. This is output line.
5.
Draw perpendicular bisector O'A to meet horizontal line drawn from O' at C.
This is the centre of the circle.
6.
With C as centre and CO' as radius, draw a semicircle to meet horizontal line
from O' at B.
7.
Draw perpendicular from A on X-axis, meeting at point D.
l(AD)
= 8.2 cm = WSN
Power
scale = WSN / l(AD) = 28400 / 8.2 = 3463.41 W/cm
8.
As the stator and rotor ohmic losses are equal, point E is mid-point of AF i.e.
AE = AF.
Join
OTi. This is the torque line.
9.
To locate full load point, draw AA' such that
AA’
= 15 kW = 15000 W
=
15000 / 3463.41 = 4.33 cm
10.
Draw parallel to the output line from A' to meet circle at point P. This is the
full load point.
11.
Draw vertical line from P to intersect output line at Q, torque line at R, base
line at S and X-axis at T.
So
at full load,


Examples
for Practice
Example
6.5.8 A 5-kW, 220 V, 50-Hz, 6-pole, 3-phase,
star-connected induction motor gave the following test data :
No-load
test : 220 V, 6 A, 475 W (Line values)
Blocked
rotor test : 110 V, 27 A, 1930 W.
Determine
from circle diagram for full load condition the line current, p.f, torque, slip
and efficiency. Also determine maximum output, maximum torque and slip for
maximum torque. Take stator cu. loss at stand still twice the rotor cu. loss.
[Ans.:
i) 18 A, ii) 0.88 lagging, iii) 5121.1878 syn-watts, iv) 7.46 %, v) 82.05 %,
vi) 6955.64 W, vii) 7796.435 Syn-Watts, viii) 14.7 %]
Example
6.5.9 Draw the circle diagram for a 5.5 kW, 400 V,
3-phase, 50 Hz, 4-pole slip ring induction motor from the test data given below
(line values) :
No
load test: 400 V, 6 A, 0.085 p.f. lag
Blocked
rotor test : 100 V, 12 A, 700 W
The ratio of primary to secondary turns is 2.6, stator resistance per phase is 0.67 Q and that of rotor is 0.18 Ω. Calculate,
i)
Full load current
ii)
Full load slip
iii)
Ratio of maximum torque to full load torque iv) Starting torque.
[Ans.:
i) 13.5 A, ii) 6.8 %, iii) 1.965, iv) 44.96 N-m]
Example
6.5.10 Draw the circle diagram for a 20 HP, 50 Hz, 3
phase, star connected induction motor with the following data.
No
load test : 400 V, 9 A, 0.2 p.f. lagging
Blocked
rotor test : 200 V, 50 A, 0.4 p.f. lagging
Determine
the line current and efficiency for full load condition from the circle
diagram.
[Ans.:
30 A (0.866 lag), 80.75 %]
Example
6.5.11 Draw the circle diagram from no load and short
circuit test of a 3-phase, 14.92 kW, 400 V, 6 pole induction motor with the
following test data (line values).
No
load : 400 V, 11 A, p.f. = 0.2
S.C.
Test : 100 V, 25 A, p.f. = 0.4
Rotor
copper loss at standstill is half the total copper loss. From the diagram, find
i)
Line current ii) Slip iii) Efficiency iv) p.f. at full load and v) Maximum
torque.
[Ans.:
32.75 A, 6.5 %, 80.73 %, 0.83 log, 26673.57 synchronous watts]
Example
6.5.12 A 415 V, 29.84 kW, 50 Hz, delta connected motor
gave the following test data.
No-load
test : 415 V, 21 A, 1250 W
Blocked
rotor test : 100 V, 45 A, 2730 W
Construct
the circle diagram and determine i) Line current and power factor for rated
output ii) The maximum torque. Assume stator and rotor copper losses are equal
at standstill.
[Ans.
: 59.44 A, 0.819 lagging, 52595.93 syn-watts]
Review Questions
1. Explain the procedure of drawing circle diagram of an
induction motor. What information can be drawn from the circle diagram and how
?
2. How the performance of an induction motor is predicted at a
given load, using a circle diagram ?
3. How the various maximum quantities can be obtained from a
circle diagram ?
4. How full load point can be located on a circle diagram ?
Electrical Machines II: UNIT III: b. Circle Diagram : Tag: Engineering Electrical Machines - II : Induction Motor - Construction of the Circle Diagram
Related Topics
Related Subjects
Electrical Machines II
EE3405 Machine 2 EM 2 4th Semester EEE Dept | 2021 Regulation | 4th Semester EEE Dept 2021 Regulation