Transmission and Distribution: Unit II: (a) Modelling and Performance of Transmission Lines
Effect of Load P.F. on Regulation and Efficiency
Modelling and Performance of Transmission Lines
1. Explain the influence of power factor on the performance of a transmission line. 2. A single phase overhead transmission line delivers 1100 kW at 11 kV at 0.8 p.f. lagging. The total resistance and inductive reactance of the line are 8 and 16 respectively. Determine i) Sending end voltage ii) Sending end power factor iii) Transmission efficiency iv) Percentage regulation. [Ans : 13.038 kV 4.398,0.7518 lagging, 89.79 %, 18.52 %] 3. An overhead 3 phase transmission line delivers 3000 kW at a 0.8 pfl lagging to a load. The resistance and reactance of each conductor is 4 and 6 respectively. If the sending end voltage is 33 kV, determine i) Sending end voltage ii) Transmission efficiency. [Ans.: 31.96 kV, 99.24 %] 4. A three phase, 11 kV, 50 Hz, transmission line 10 km long delivers a load of 5 MW at 0.8 pfl lag at the far end. The resistance and reactance per phase, per km are 0.1 and 0.2 ohm respectively. Find sending end voltage, current and pfl Also draw the phasor diagram. Treat the line as a short AU : Oct.-96 [Ans.: 7.01 kV, 328.03 A, 0.7711 lag] 5. A 3-phase 5 km long transmission line, having resistance of 0.5 Ω / km and inductance of 1.76 mH/km is delivering power at 0.8 p.f. lagging. The receiving end voltage is 32 kV. If the supply end voltage is 33 kV, 50 Hz find 1) Line current 2) Regulation and 3) Efficiency of the transmission line. [Ans.: 31.108 A, 3.156 %, 98.44 %] 6. Derive expressions for regulation and efficiency of a short transmission line. Draw required circuit and phasor diagram. 7. Draw the phasor representation of short transmission line.
Effect of Load P.F. on
Regulation and Efficiency
AU : Oct-96, 2000, May-06, 07, 08,
Dec.-12, 17
The load p.f. has considerable effect on
the regulation and efficiency of transmission line.
Consider the approximate expression for VS

This expression is valid for lagging
power factor. In case of leading power factor the expression for voltage
regulation is given by,

When the load power factor is lagging or unity such that IR cos ϕR > IXL sin ϕR then the voltage regulation is positive. It indicates that the receiving end voltage VR is less than sending end voltage VS.
With decrease in the power factor in
case of lagging loads, the voltage regulation of the line increases for given
values of VR and I.
If the load power factor is such that IXL
sin ϕR > IR sin ϕR, then voltage regulation is
negative which indicates that receiving end voltage VR is more than the sending
end voltage VS.
For leading power factor loads, the
voltage regulation of the line decreases with decrease in p.f.
The phasor diagram for lagging load,
unity p.f. load and leading p.f. load is shown in the Fig. 2.7.1.
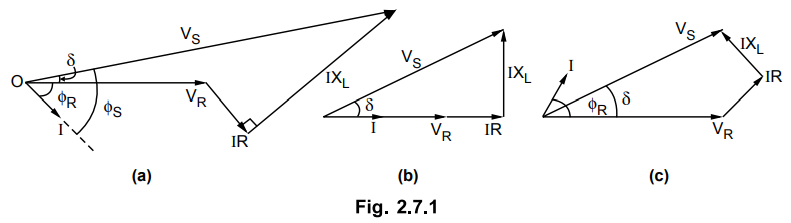
The angle between VR and VS
is called power angle and denoted as δ.
The power delivered to the load depends
upon the power factor. For single phase circuit power is given by,

It can be seen that for a given power
transmitted (P) at the voltage (VR) at the receiving end, the load current I is
inversely proportional to the load power factor, cos ϕR.
If the load p.f. is low then current and hence losses will be more which will
decrease transmission efficiency.
Example 2.7.1
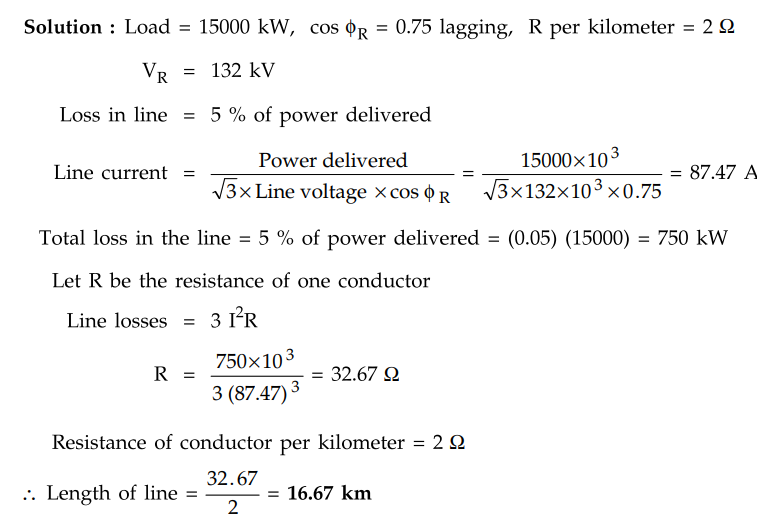
Find the distance over which a load of 15000 kW at a p.f. of 0.75 lagging
can be delivered by a 3 phase transmission line having conductors each of
resistance 2 Q per kilometer. The voltage at the receiving end is 132 kV and
the loss in the transmission is to be 5 %.
Solution :
Load = 15000 kW, cos ϕR = 0.75 lagging, R per kilometer = 2 Ω
VR = 132 kV
Loss in line = 5 % of power delivered
Example 2.7.2
A 15 km long 3 phase overhead line delivers 5 MW at 11 kV at 0.8 lagging
p.f, line loss is 12 % of power delivered. Line inductance is 1.1 mH per km per
phase. Find the sending end voltage and regulation.
Solution :
Load p.f., cos ϕR = 0.8 lagging ϕR = 36.86°

Example 2.7. 3 A short 3-phase transmission line with an impedance of (6 + j8) Q per phase
has sending and receiving end voltages of 120 kV and 110 kV respectively for
some receiving end load at a pf of 0-9 lagging. Determine power output and
sending end power factor.
AU : May-07, Marks 8
Solution :

Example 2.7.4
A three - phase transmission line having a series impedance of (20 + j30) Q
delivers 7 MW at 33 kV and 0.8 lagging power factor. Find the sending end
voltage, regulation and power angle. Neglect shunt capacitance.
Solution :

Review Questions
1. Explain the influence of power factor on the performance
of a transmission line.
2. A single phase overhead transmission line delivers 1100
kW at 11 kV at 0.8 p.f. lagging. The total resistance and inductive reactance
of the line are 8 and 16 respectively. Determine i) Sending end voltage ii)
Sending end power factor iii) Transmission efficiency iv) Percentage
regulation.
[Ans : 13.038 kV 4.398,0.7518 lagging, 89.79 %, 18.52 %]
3. An overhead 3 phase transmission line delivers 3000 kW
at a 0.8 pfl lagging to a load. The resistance and reactance of each conductor
is 4 and 6 respectively. If the sending end voltage is 33 kV, determine i)
Sending end voltage ii) Transmission efficiency.
[Ans.: 31.96 kV, 99.24 %]
4. A three phase, 11 kV, 50 Hz, transmission line 10 km
long delivers a load of 5 MW at 0.8 pfl lag at the far end. The resistance and
reactance per phase, per km are 0.1 and 0.2 ohm respectively. Find sending end
voltage, current and pfl Also draw the phasor diagram. Treat the line as a
short
AU : Oct.-96
[Ans.: 7.01 kV, 328.03 A, 0.7711 lag]
5. A 3-phase 5 km long transmission line, having resistance
of 0.5 Ω / km and inductance of 1.76 mH/km is delivering power at 0.8 p.f.
lagging. The receiving end voltage is 32 kV. If the supply end voltage is 33
kV, 50 Hz find 1) Line current 2) Regulation and 3) Efficiency of the
transmission line.
[Ans.: 31.108 A, 3.156 %, 98.44 %]
6. Derive expressions for regulation and efficiency of a
short transmission line. Draw required circuit and phasor diagram.
7. Draw the phasor representation of short transmission line.
Transmission and Distribution: Unit II: (a) Modelling and Performance of Transmission Lines : Tag: : Modelling and Performance of Transmission Lines - Effect of Load P.F. on Regulation and Efficiency
Related Topics
Related Subjects
Transmission and Distribution
EE3401 TD 4th Semester EEE Dept | 2021 Regulation | 4th Semester EEE Dept 2021 Regulation