Statistics and Numerical Methods: Unit II: Design of Experiments
EXERCISE 2.3 [Two-way classification] [RBD]
Solved Example Problems | Design of Experiments | Statistics
Statistics and Numerical Methods : Unit - II : Design of Experiments : EXERCISE 2.3 [Two-way classification] [RBD]
EXERCISE 2.3 [Two-way classification] [RBD]
1. The following table gives the yields of wheat from 16 plots, all of approximately equal fertility, where 4 varieties of wheat were cultivated in a completely randomized fashion. Test the hypothesis that the varieties are not significantly different.

2. A randomized block experiment was laid out (with 4 blocks, each block containing 4 plots) to test 4 varieties of manure A, B, C, D and the yields per acre are given as below. Test for the significance of the difference among the 4 varieties of manure.

3. The table given below shows the yield of a certain crop in kgs per plot. The letters A, B, C, D refer to 4 different manurial treatments. Carry out an analysis of variance.
4. In the table given below are the yields of 6 varieties of a crop in a 4 replicate RBD experiment.

5. The following table gives the gains in weights of 4 different types of pigs, fed on 3 different rations over a period. Test whether. (i) the difference bais in the rations is significant. (ii) the 4 types of pigs differ significantly in esho gaining weight.

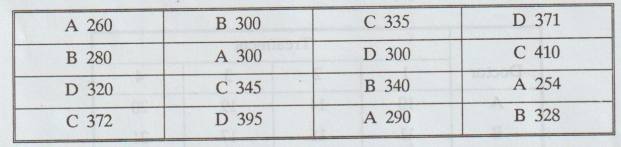
6. Three varieties of a crop are tested in a randomised block design with four replication, the layout being as given below. The yields are given in kilograms. Analyse for significance.

7. Four doctors each test four treatments for a certain disease and observe the no. of days each patient takes to recover. The results are as follows. (Recovery time in days).

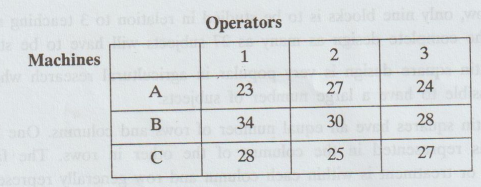
8. Discuss the difference between (a) doctors and (b) treatment. Articles manufactured by a company are produced by 3 operators using 3 different machines. The manufacturer wishes to determine whether there is a difference between the (i) operators (ii) machines. Experiments were performed to determine the number of articles produced per day by each operator using each machine and the outcome are given in table.
Provide the desired information to the manufacturer using 0.05 and 0.01 significance levels.
9. An agricultural research department wanted to test some of its new species of cotton seeds in South India. The experiments were conducted in Tamil Nadu and Andhra Pradesh with five different species using four different types of fertilizers and the results of yields are tabulated as shown below. Test at the 0.05 level, whether there is a difference in (i) Cotton species (ii) Locations.

Statistics and Numerical Methods: Unit II: Design of Experiments : Tag: : Solved Example Problems | Design of Experiments | Statistics - EXERCISE 2.3 [Two-way classification] [RBD]
Related Topics
Related Subjects

Statistics and Numerical Methods
MA3251 2nd Semester 2021 Regulation M2 Engineering Mathematics 2 | 2nd Semester Common to all Dept 2021 Regulation