Engineering Chemistry: Unit III: a. Phase Rule
Experimental Method of Construction of A Simple Eutectic Phase Diagram
Thermal analysis is a method involving a study of the cooling curves of various compositions of a system during solidification.
EXPERIMENTAL METHOD OF CONSTRUCTION OF A SIMPLE EUTECTIC PHASE
DIAGRAM
1. Thermal analysis (or) cooling curves
Thermal analysis is a method involving a study of the cooling
curves of various compositions of a system during solidification. The shapes of
the freezing point curves for any system (involving metals) can be determined
by thermal analysis. The form of the cooling curve indicates the composition of
the solid.
Example 1 : Cooling curve for a pure solid
A pure substance in the fused state is allowed to cool slowly and
the temperature is noted at different time interval. Then graph is plotted
between temperature and time (Fig. 3.2).
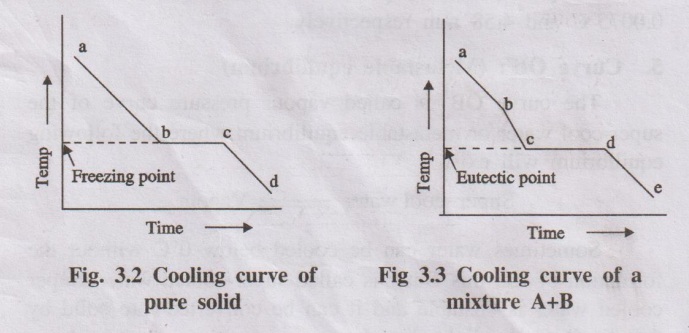
Initially the rate of cooling is continuous. When it reaches the
point ‘b' solid begins to appear, now the temperature remains constant until
the liquid melt is completely solidified. Solidification completes at the point
‘c'. The horizontal line ‘bc' represents the equilibrium between the solid and
liquid melt. After the point 'c', temperature of the solid begins to decrease
along the curve 'cd'.
Example 2 : Cooling curve for a mixture
If a mixture of two substances (say A and B) in the fused state is
allowed to cool slowly, the cooling curve is obtained in a similar manner (Fig.
3.3).
Initially the rate of cooling is continuous. When it reaches the
point b'one substance (either A or B) begins to solidify out of the melt, which
is indicated by a break and the rate of cooling is different. On further cooling
at the break point 'c'the second compound also begins to solidify. Now the
temperature remains constant until the liquid melt is completely solidified,
which forms the eutectic mixture (line cd). After the break point d'cooling of
solid mass begins. The temperature of horizontal line 'cd' gives the eutectic
temperature.
The experiment is repeated for different compositions of A and B
and the various cooling curves are recorded. From the cooling curves of various
compositions, the main phase
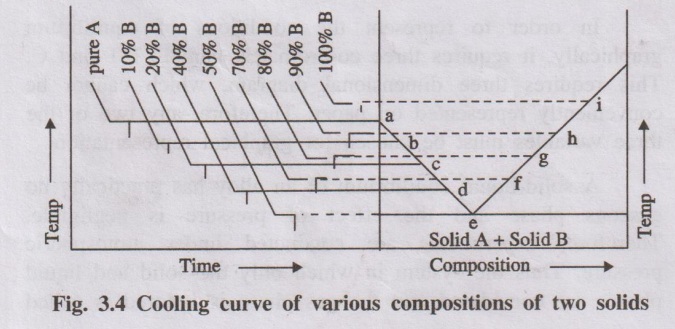
Fig. 3.4 Cooling curve of various compositions of two solids
diagram can be drawn by taking composition in X-axis and the
temperature in Y-axis. (Fig. 3.4)
Uses of cooling curves
1. Melting point and eutectic temperature can be noted from the cooling
curve.
2. Percentage purity of the compounds can be noted from the
cooling curve.
3. The behaviour of the compounds can be clearly understood from
the cooling curve.
4. The composition corresponding to its freezing point yields the
composition of the alloy.
5. The procedure of thermal analysis can be used to derive the phase diagram of any two component system. company
Engineering Chemistry: Unit III: a. Phase Rule : Tag: Engineering Chemistry : - Experimental Method of Construction of A Simple Eutectic Phase Diagram
Related Topics
Related Subjects

Engineering Chemistry
CY3151 1st Semester | 2021 Regulation | 1st Semester Common to all Dept 2021 Regulation