Problem Solving and Python Programming: UNIT IV: Lists, Tuples, Dictionaries
Illustrative Python Programs
Lists, Tuples, Dictionaries
1. Simple Sorting 2. Histogram 3. Students Marks Statement 4. Retail Bill Preparation
Illustrative Programs
AU : Dec.-19, Marks 6
1. Simple Sorting
1.
Selection Sort
The
selection sort method descibes as follows - Scan the array to find its smallest
element and swap it with the first element. Then, starting with the second
element scan the entire list to find the smallest element and swap it with the
second element. Then starting from the third element the entire list is scanned
in order to find the next smallest element. Continuing in this fashion we can
sort the entire list.
Example
:
Consider the elements
70,
30, 20, 50, 60, 10, 40
We
can store these elements in array A as :
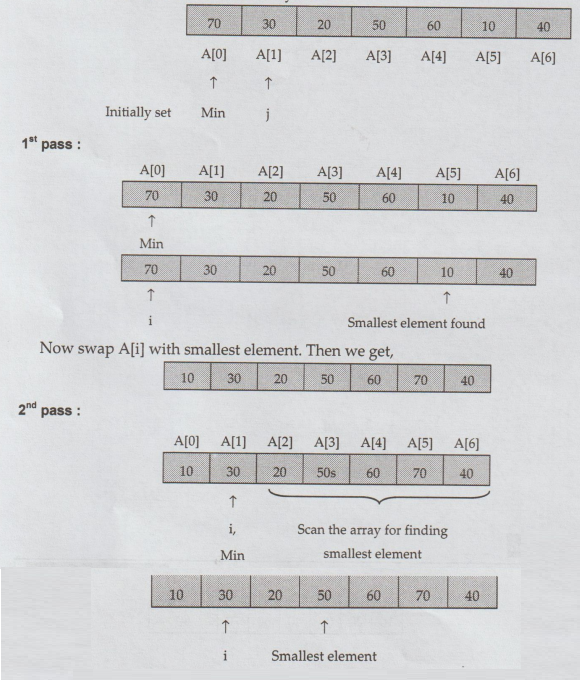
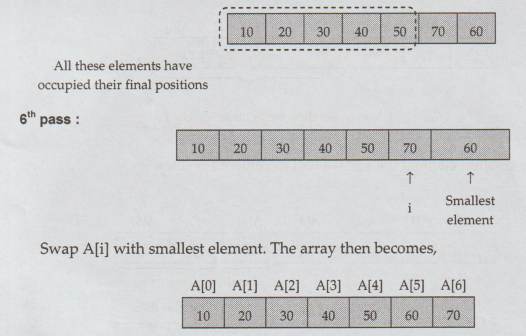
Swap
A[i] with smallest element. The array becomes,
As
there is no smallest element than 30 we will increment i pointer.
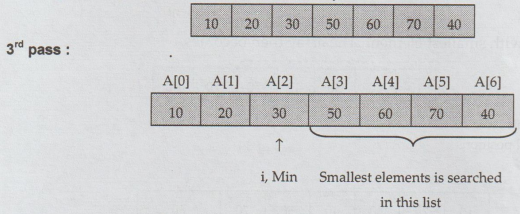
4th
pass :
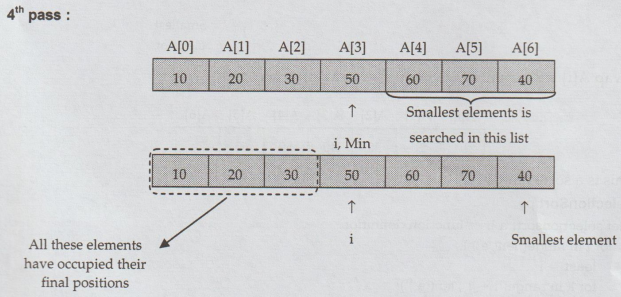
Swap
A[i] with smallest element. The array then becomes,
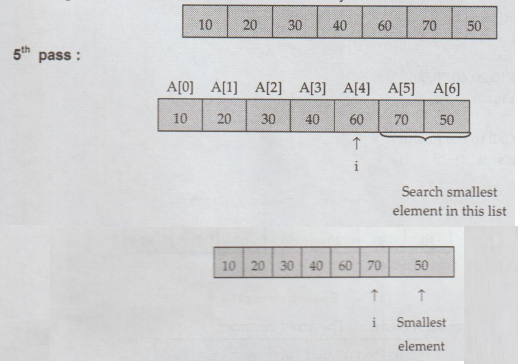
Swap
A[i] with smallest element. The array then becomes,
This
is a sorted array.
SelectionSort.py
def
selectionsort(a): #function definition
for
i in range( len( a )):
least
= i
for
k in range( i + 1, len( a )):
if
a[k] < a[least):
least
= k
temp
= a[least]
a[least]
= a[i]
a[i]
= temp
a
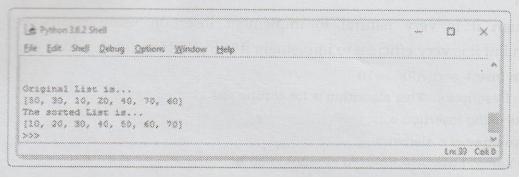
= (50,30,10,20,40,70,60]
print("Original
List is...")
print(a)
selectionsort(a)
#Call to the function
print("The
sorted List is...")
print(a)
Output
2.
Insertion Sort
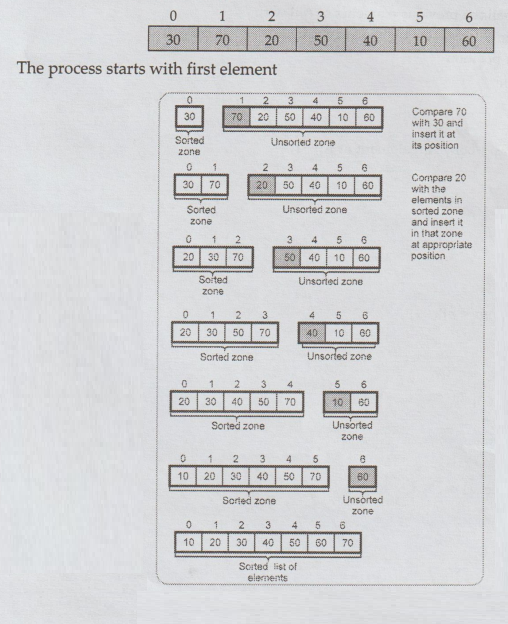
In
this method the elements are inserted at their appropriate place. Hence is the
name insertion sort. Let us understand this method with the help of some
example -
For
Example
Consider
a list of elements as,
Algorithm
Although
it is very natural to implement insertion using recursive(top down) algorithm
but it is very efficient to implement it using bottom up(iterative) approach.
Algorithm
Insert_sort(A[O...n-1])
//
Problem Description: This algorithm is for sorting the
//elements
using insertion sort
//Input:
An array of n elements
//Output:
Sorted array A[O...n-1) in ascending order
for
i 1 to n-1 do
{
temp
← A[i]//mark A[i]th element
j
i-1//set j at previous element of A[i]
while(j>=0)AND(A[j]>temp)do
{
//comparing
all the previous elements of A[i] with
//A[i].If
any greater element is found then insert
//it
at proper position
A[j+1]
← A[j]
j
← j-1
}
A[j+1]
+ temp //copy A[i] element at A[j+1]
}
InsertionSort.py
def
insertionsort( a):
for
i in range( 1, len( a )):
tmp
= a[i]
k
= i
while
k > 0 and tmp < a[k - 1]:
a[k]
= a[k - 1]
k
- = 1
a[k]
= tmp
a
= (50,30,10,20,40,70,60]
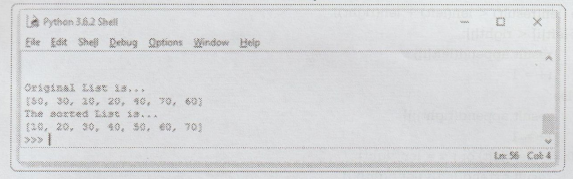
print("Original
List is...")
print(a)
insertionsort(a)
print("The
sorted List is...")
print(a)
TECHNICAL
PUBLICATIONS® - an up-thrust for knowledge
Output
3.
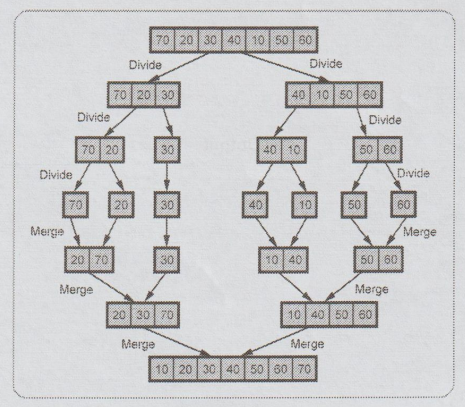
Merge Sort
Merge
sort on an input array with n elements consists of three steps:
Step
1:
partition array into two sub lists s1 and s2 with n/2 elements each.
Step
2:
Then sort sub list s1 and sub list s2.
Step
3:
Merge s1 and s2 into a unique sorted group.
Example
:
Consider the elements as
70,
20,30, 40, 10, 50, 60
Now
we will split this list into two sublists.
mergersort.py
def
merge(left, right):
if
not len(left) or not len(right):
return
left or right
result
= [ ]
i.j
= 0,0
while
(len(result) < len(left) + len(right)):
if
left[i] < right[j]:
result.append(left[i])
i
+ = 1
else:
result.append(right[j])
j+=
1
if
i = = len(left) or j = = len(right):
result.extend(left[i:)
or right[i:1)
break
return
result
def
mergesort(a):
if
len(a) < 2:
return
a
middle
= int(len(a)/2)
left
= mergesort(a[:middle])
right
= mergesort(a[middle:))
return
merge(left, right)
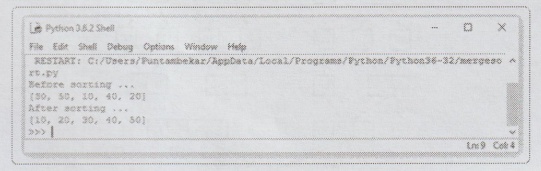
a
= [30,50,10,40,20]
print("Before
sorting ...")
print(a)
print("After
sorting ...")
print(mergesort(a))
Output
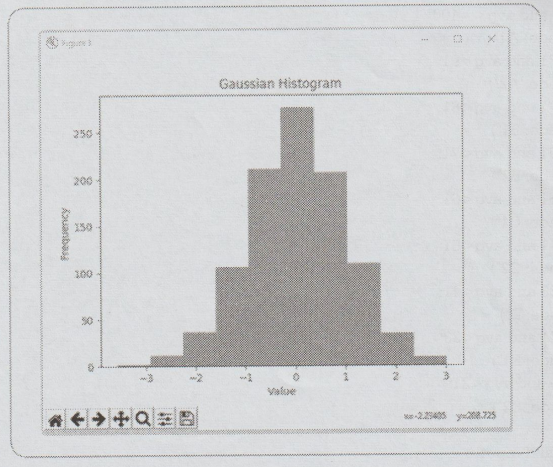
2. Histogram
Definition
of Histogram : Histogram is visual representation of
the distribution of quantitative variable. It is appeared as vertical bar
graph. It represents the distribution of variable being studied.
Representation
of Histogram
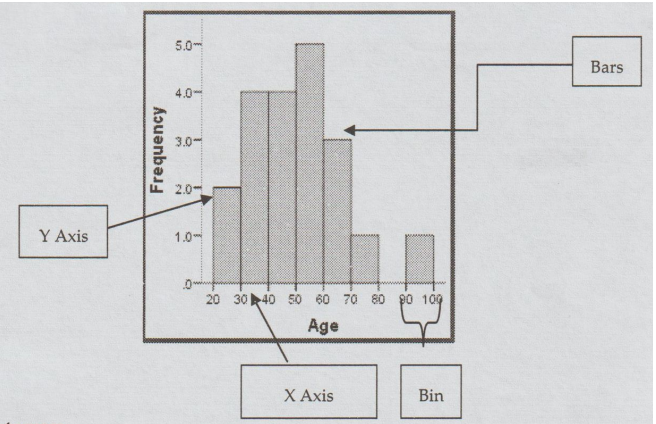
Parts
of Histogram
Title
:
The title gives a brief description of what the information is represented by
the histogram.
Horizontal
or X-Axis : The horizontal or X-axis shows you the
range or the values of gaps in between variables. They are commonly called
class intervals which represent or summarize large data sets.
Vertical
or Y-Axis : The vertical or Y-axis represents the
range values of frequencies or the number of times that the class intervals
occurred.
Bars
:
The bars represent the object, item, event, or person from where the variables
arise. Their height denotes their respective frequencies, while the bar
placement along the X-axis indicates their respective interval values. The
width, however, is the same for all bars.
Bin
:
Histograms use bins to display data-where a bin represents a given range of
values.
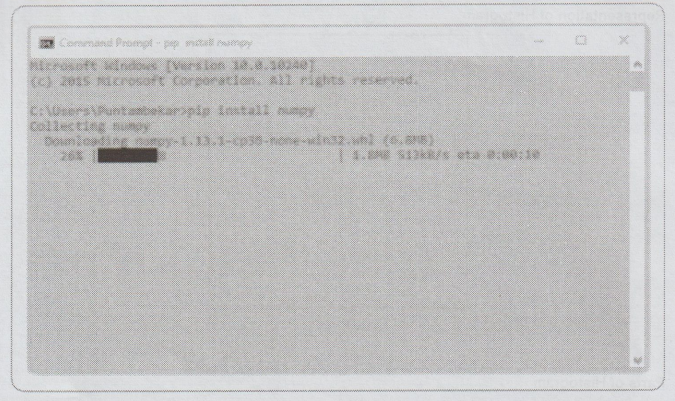
It
is very simple to plot the Histogram in Python, but for that we need to install
few libraries - namely numpy, scipy and mathplotlib.
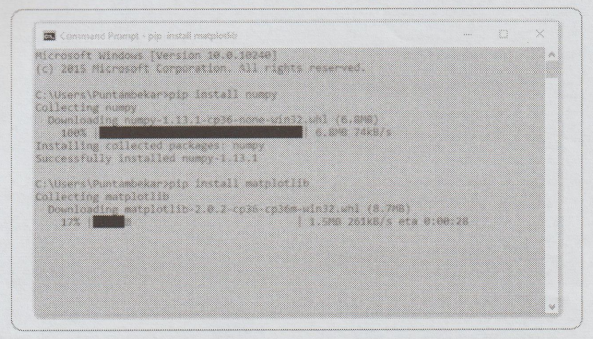
Step
1:
For installing numpy, open the command prompy and issue following command
Step
2:
For installing scipy, open the command prompy and issue following command
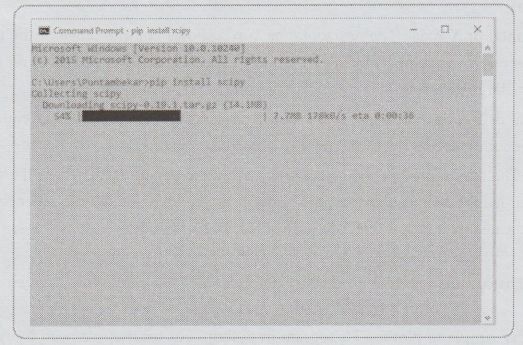
Step
3:
For installing matlib, open the command prompt and issue following command
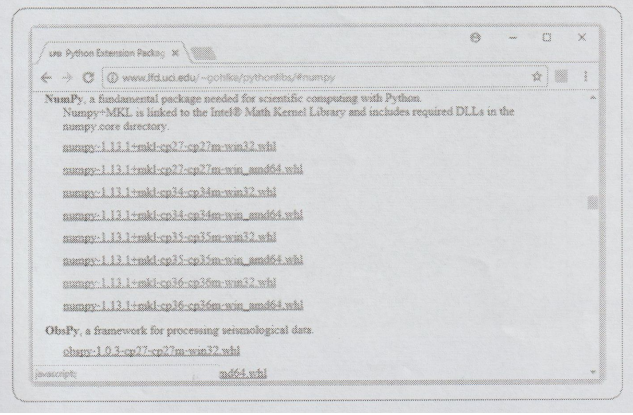
Very
often, installation of Scipy in above manner fails. Hence we need to adopt
another method to install Scipy. For that purpose open the site http://www.lfd.uci.edu/-gohlke/pythonlibs/
Search
for Scipy. Here before installing SciPy, you need to install numpy+MKL by
clicking following link.
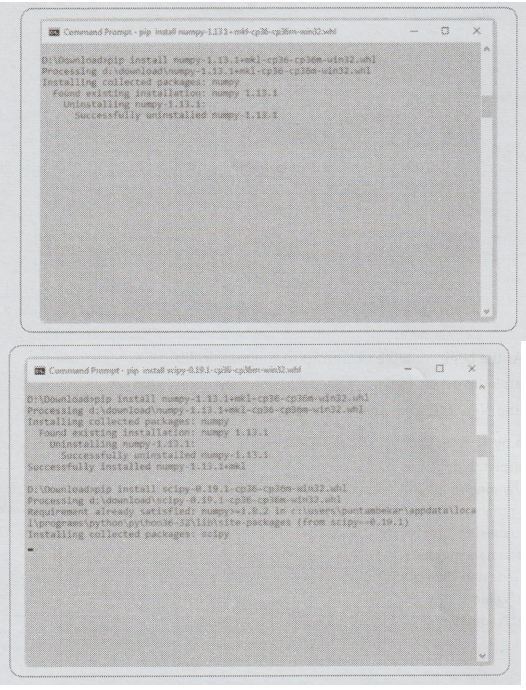
Now
install Scipy

Now
open the command prompt, change the directory to your download folder and issue
the pip install command for numpy installation and then for Scipy
Step
4 :
Thus now all the necessary installations for plotting the histogram is
complete. This can be verified by opening the Python Shell and issuing
following commands

As
there is no error messages and we get prompt, everything is successfully
installed.
Program
For Histogram
Step
1:
The histogram is drawn from Gaussian distribution. This is a normal
distribution. For plotting the numbers we use gaussian_numbers = normal
(size=1000)
Step
2 :
The normal distribution function can be obtained using from numpy.random
import normal.
The
hist ( ) method is used to generate histogram. The numbers that are used for
generating the histogram are passed to hist( ) method as parameter.
Step
3:
Similarly there are title, xlabel and ylabel functions for giving title, label
to X-axis and Y-axis.
Step
4:
Finally we use show method for displaying the histogram.
Step
5: At
the beginning we must import the matplotlib import matplotlib.pyplot as plt
Open
the New file, and write following program for plotting the histogram.
histogram.py
import
matplotlib.pyplot as plt
from
numpy.random import normal
gaussian_numbers
= normal(size=1000)
#plt.hist(gaussian_numbers)
plt.hist(gaussian_numbers)
plt.title("Gaussian
Histogram")
plt.xlabel("Value")
plt.ylabel("Frequency")
plt.show()

Now
run the above program by pressing F5 key and you will get following output
3. Students Marks Statement
The
marks statement of student contains the roll number, name, marks and grade of
the student. The python code is as follows –
print("Enter
roll number of Student")
roll
= int(input())
print("Enter
name of Student")
name
= input()
mark
= []
tot
= 0
print("Enter
Marks Obtained in 5 Subjects: ")
for
i in range(5):
mark.insert(i,
input())
for
i in range(5):
tot
= tot + int(mark[i])
avg
= tot/5
print("Roll
Number: ",roll)
print("Name:",name)
print("Total
Marks = ",tot)
print("Percentage
= ",avg,"%")
if
avg > = 91 and avg < = 100:
print("Grade:
A1")
elif
av g> = 81 and avg < 91:
print("Grade:
A2")
elif
avg > = 71 and avg < 81:
print("Grade:
B1")
elif
avg > = 61 and avg < 71:
print("Grade:
B2")
elif
avg > = 51 and avg < 61:
print("Grade:
C1")
elif
avg > = 41 and avg < 51:
print("Grade:
C2")
elif
avg > = 33 and avg < 41:
print("Grade:
D")
elif
avg > = 21 and avg < 33:
print("Grade:
E1")
elif
avg > = 0 and avg < 21:
print("Grade:
E2") else:
print("Invalid
Input!")
Output
Enter
roll number of Student
101
Enter
name of Student
AAA
Enter
Marks Obtained in 5 Subjects:
77
66
44
33
68
68
Roll Number: 101
Name:
AAA
Total
Marks = 288
Percentage
= 57.6 %
Grade:
C1
>>>
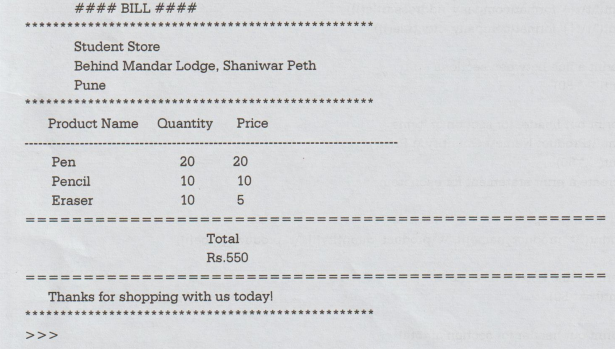
4. Retail Bill Preparation
Python
Program
product_name
= [ ]
product_quantity
= [ ]
product_price
= [ ]
#
create a company name and information
company_name
= 'Student Store'
company_address
= 'Behind Mandar Lodge, Shaniwar Peth'
company_city
= 'Pune'
#
declare ending message
message
= 'Thanks for shopping with us today!
for
i in range(3):
product_name.append(input('Enter
name of the product: '))
product_quantity.append(int(input('Enter
the quantity of the product: ')))
product_price.append(int(input('Enter
the price of the product: ')))
#
create a top border
print("\n\t\t####
BILL ####")
print('*\
* 50)
#
print company information first using format
print("\t\t{}'.format(company_name.title()))
print("\t\t{}'.format(company_address.title()))
print("\t\t{}'.format(company_city.title()))
#
print a line between sections
print('**
50)
#
print out header for section of items
print("\tProduct
Name\t Quantity \t Price')
print('-'*
50)
#
create a print statement for each item
i
= 0 for i in range(3):
print("\t",product_name[i],"\t",product_quantity[i],"\t",product_price[i])
#
print a line between sections
print('='
* 50)
#
print out header for section of total
print("\t\t\t\tTotal')
total
= 0
i
= 0
#
calculate total price and print out
for
i in range(3):
total
+ = (product_price[i]*product_quantity[i])
print("\t\t\t\tRs.{}'.format(total))
#
print a line between sections
print('='
* 50)
#
output thank you message
print("\n\t{}\n'.format(message))
#
create a bottom border
print('*'
* 50)
Output
Enter
name of the product: Pen
Enter
the quantity of the product: 20
Enter
the price of the product: 20
Enter
name of the product: Pencil
Enter
the quantity of the product: 10
Enter
the price of the product: 10
Enter
name of the product: Eraser
Enter
the quantity of the product: 10
Enter
the price of the product: 5
####
BILL ####
Review Questions
1. Outline the algorithm and write the Python program to sort
the numbers in ascending order using merge sort.
AU : May-19, Marks 16, Dec.-19, Marks 8
2. Write script in Python to sort n numbers using selection
sort.
AU : Dec.-19, Marks 12
Problem Solving and Python Programming: UNIT IV: Lists, Tuples, Dictionaries : Tag: Engineering Python : Lists, Tuples, Dictionaries - Illustrative Python Programs
Related Topics
Related Subjects
Problem Solving and Python Programming
GE3151 1st Semester | 2021 Regulation | 1st Semester Common to all Dept 2021 Regulation