Electrical Machines II: UNIT III: b. Circle Diagram
Obtaining Data to Plot Circle Diagram
Three Phase Induction Motor
The data required to draw the circle diagram is obtained by conducting two tests which are, 1. No load test or open circuit test 2. Blocked rotor test or short circuit test Let us discuss these tests in detail.
Obtaining Data to Plot Circle Diagram
The
data required to draw the circle diagram is obtained by conducting two tests
which are,
1.
No load test or open circuit test
2.
Blocked rotor test or short circuit test
Let
us discuss these tests in detail.
1. No load test
In
this test, the motor is made to run without any load i.e. no load condition. The
speed of the motor is very close to the synchronous speed but less than the
synchronous speed. The rated voltage is applied to the stator. The input line
current and total input power is measured. The two wattmeter method is used to
measure the total input power. The circuit diagram for the test is shown in the
Fig. 6.4.1.
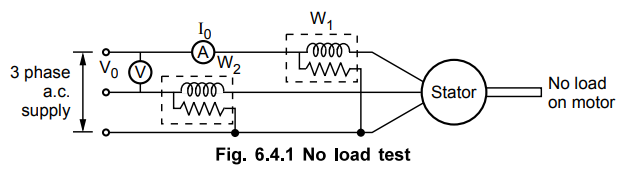
As
the motor is on no load, the power factor is very low which is less than 0.5
and one of the two wattmeters reads negative. It is necessary to reverse the
current coil or pressure coil connections of such a wattmeter to get the
positive reading. This reading must be taken negative for the further
calculations.
The
total power input W0 is the algebraic sum of the two wattmeter
readings. The observation table is,

The
calculations are,
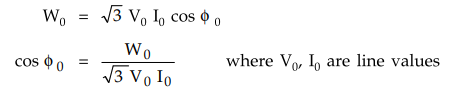
This
is no load power factor.
Thus
we are now in a position to obtain magnitude and phase angle of no load current
I0, which is required for the circle diagram.
From
the knowledge of I0 and ϕ0, the parameters of the
equivalent circuit can be obtained as,
Ic
= I0 cos ϕ0 = active component of no load current
Im
= I0 sin ϕ0 = magnetising component of no load current
R0
= V0 (per phase) / Ic (per phase) = no load branch
resistance
X0=
V0 (per phase) / Im (per phase) = no load branch
reactance
The
power input W0 consists of following losses,
1.
Stator copper loss i.e. 3I02 R1 where I0
is no load per phase current and R1 is stator resistance per phase.
2.
Stator core loss i.e. iron loss.
3.
Friction and windage loss.
The
no load rotor current is very small and hence rotor copper loss is negligibly
small. The rotor frequency is s times supply frequency and on no load it is
very small. Rotor iron losses are proportional to this frequency and hence are
negligibly small.
Under
no load condition, I0 is also very small and in many practical cases
it is also neglected. Thus W0 consists of stator iron loss and
friction and windage loss which are constants for all load conditions. Hence W0
is said to give fixed losses of the motor.
W0
= no load power input
W0 = ... Neglecting stator copper loss
a.
Separating No Load Losses
The
no load losses are the constant losses which include core loss and friction and
windage loss. The separation between the two can be carried out by the no load
test conducted from variable voltage, rated frequency supply.
When
the voltage is decreased below the rated value, the core loss reduces as nearly
square of voltage. The slip does not increase significantly the friction and
windage loss almost remains constant.
The
voltage is continuously decreased till the machine slip suddenly begins to
increase and the motor tends to stall. At no load, this takes place at a
sufficiently reduced voltage. The graph showing no load losses PN.L. versus V
as shown in the Fig. 6.4.2 is extrapolated to V = 0 which gives friction and
windage loss as iron or core loss is zero at zero voltage.

2. Blocked Rotor Test
In
this test, the rotor is locked and it is not allowed to rotate. Thus the slip s
= 1 and RL= R2 (1 - s)/s is zero. If the motor is slip
ring induction motor then the windings are short circuited at the slip rings.
The
situation is exactly similar to the short circuit test on transformer. If under
short circuit condition, if primary is excited with rated voltage, a large
short circuit current can flow which is dangerous from the windings point of
view. So similar to the transformer short circuit test, the reduced voltage
(about 10 to 15 % of rated voltage) just enough such that stator carries rated
current is applied. Now the applied voltage Vsc, the input power Wsc
and a short circuit current Isc are measured.
As
RL = 0, the equivalent circuit is exactly similar to that of a
transformer and hence the calculations are similar to that of short circuit
test on a transformer.
Vsc
= Short circuit reduced voltage (line value)
Isc
= Short circuit current (line value)
Wsc
= Short circuit input power
Now
Wsc = √3 Vsc Isc … Line values
Cos
ϕsc = Wsc / √3 Vsc Isc
This
gives us short circuit power factor of a motor.
Now
the equivalent circuit as shown in the Fig.6.4.3.

This
is equivalent resistance referred to stator.

During
this test, the stator carries rated current hence the stator copper loss is
also dominant. Similarly the rotor also carriers short circuit current to
produce dominant rotor copper loss. As the voltage is reduced, the iron loss
which is proportional to voltage is negligibly small. The motor is at
standstill hence mechanical loss i.e. friction and windage loss is absent.
Hence we can write,
Wsc
= Stator copper loss + Rotor copper loss
But
it is necessary to obtain short circuit current when normal voltage is applied
to the motor. This is practically not possible. But the reduced voltage test
results can be used to find current ISN which is short circuit current if
normal voltage is applied.
If
VL = Normal rated voltage (line value)
Vsc
= Reduced short circuit voltage (line value)
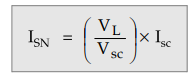
where Isc = Short circuit current
at reduced voltage
Thus, ISN = Short circuit current at
normal voltage
Now
power input is proportional to square of the current
So WSN = Short circuit input power
at normal voltage
This
can be obtained as,

But
at normal voltage core loss can not be negligible hence,
WSN
= Core loss + Stator and rotor copper loss
Review Questions
1. Which tests are required to be performed to obtain the data
for the circle diagram ? How these tests are performed?
2. What data is obtained by conducting the no load test and
short circuit test on three phase induction motor ?
Electrical Machines II: UNIT III: b. Circle Diagram : Tag: Engineering Electrical Machines - II : Three Phase Induction Motor - Obtaining Data to Plot Circle Diagram
Related Topics
Related Subjects
Electrical Machines II
EE3405 Machine 2 EM 2 4th Semester EEE Dept | 2021 Regulation | 4th Semester EEE Dept 2021 Regulation