Statistics and Numerical Methods: Unit II: Design of Experiments
One Way Classification
Merits, Demerits, Applications, Solved Example Problems | Design of Experiments | Statistics
One-way classification observations are classified according to one factor. This is exhibited column-wise.
ONE WAY CLASSIFICATION
One-way
classification observations are classified according to one factor. This is
exhibited column-wise.
A
set of N = cr observations classified in one direction may be represented as
follows.
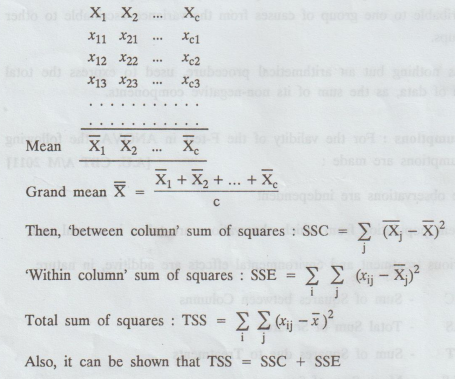
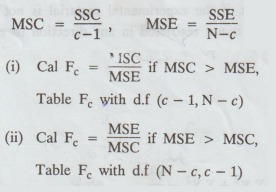
If
each of these sum of squares is divided by the corresponding number of degrees
of freedom, we get the mean sum of squares. These information are presented in
the following table called ANOVA table.
(Analysis
of Variance Table)
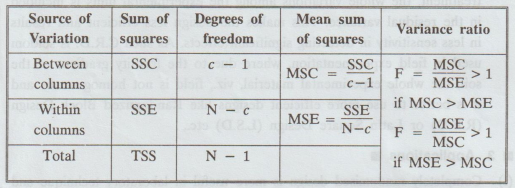
The
F ratio should be calculated in such a way that F > 1.
Completely
Randomized Design (C.R.D)
The
completely randomized design is the simplest of all the designs, based on
principles of randomization and replication. In this design, treatments are
allocated at random to the experimental units over the entire experimental
material.
1. Merits
(i)
C.R.D. results in the maximum use of the experimental units, since all
the experimental material can be used.
(ii)
The design is very flexible. Any number of treatments can be used and
different treatments can be used unequal number of times without unduly
complicating the statistical analysis in most of the cases.
(iii)
The statistical analysis remains simple, if some or all the obsevations for any
treatment are rejected or lost or missing for some purely random accidental
reasons. We merely carry out the standard analysis on the available data.
Moreover, the loss of information due to missing data is smaller in comparison
with any other design.
(iv)
It provides the maximum number of degrees of freedom for the estimation of the
error variance, which increases the sensitivity or the precision of the
experiment for small experiments, (i.e.,) for experiments with small number of
treatments.
2. Demerits
(i)
In certain circumstances, the design suffers from the disadvantage of being
inherently less informative than other more sophisticated layouts. This usually
happens, if the experimental material is not homogeneous. Since randomization
is not restricted in any direction to ensure that the units receiving one
treatment are similar to those receiving the other treatment, the whole
variations among the experimental units is included in the residual variance.
This makes the design less efficient and results in less sensitivity in
detecting significant effects. As such C.R.D. is seldom used in field
experimentation, where due to the fertility gradient of the soil, the whole
experimental material, viz., field is not homogeneous and it is better to use
more efficient designs like Randomized Block Design (R.B.D) or Latin Square
Design (L.S.D) etc.,
3. Applications
(i)
Completely randomised design is more useful in laboratory technique and
methodological studies, (e.g.,) in physics, chemistry or cookery, in chemical
and biological experiments, in some green house studies, etc., where either the
experimental material is homogeneous or the intrinsic variability between units
can be reduced.
(ii)
C.R.D is also recommended in situations where an appreciable fraction of units
is likely to be destroyed or fail to respond.
Working
Procedure [One-way classification CRD]
1.
Ho: There is no significant difference between the treatments.
2.
H1: There is significant difference between the treatments.
Step
1:
Find N i.e., the number of observations
Step
2:
Find T i.e., the total value of all observations
Step
3:
Find T2 / N i.e., the correction factors lea
Step
4:
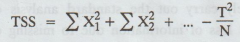
Calculate the total sum of squares.
Step
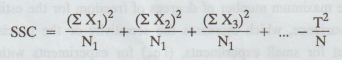
5:
Calculate the column sum of squares
Step
6:
Calculate the error sum of squares
SSE
= TSS - SSC
Step
7:
ANOVA
Step
8:
Conclusion :
(i)
If Cal Fe < Table Fe, we accept H0
(ii)
If Cal Fe > Table Fe, we reject H0
Example
2.2.1
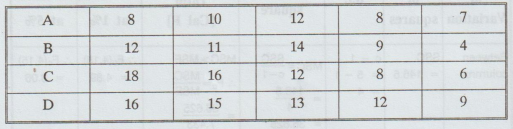
The
following are the numbers of mistakes made in 5 successive days of 4
technicians working for a photographic laboratory :
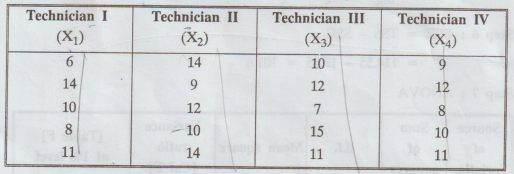
Test
at the level of significance a=0.01, whether the differences among the 4 sample
means, can be attributed to chance. [A.U. A/M 2004, A.U A/M 2011]
Solution:
H0
: There are no significant differences in technicians.
H1
: There is significant difference between the technicians.
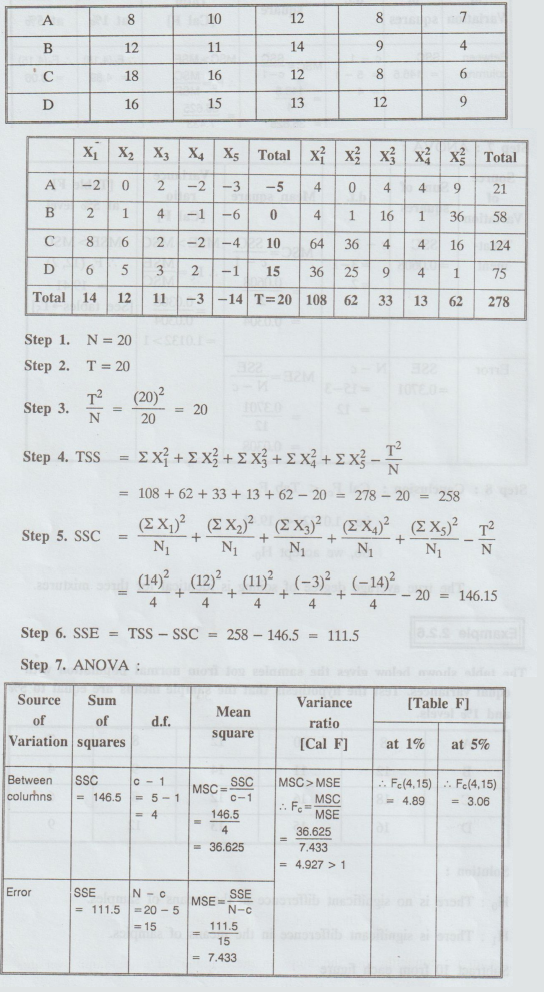
We
shift the origin to 10.
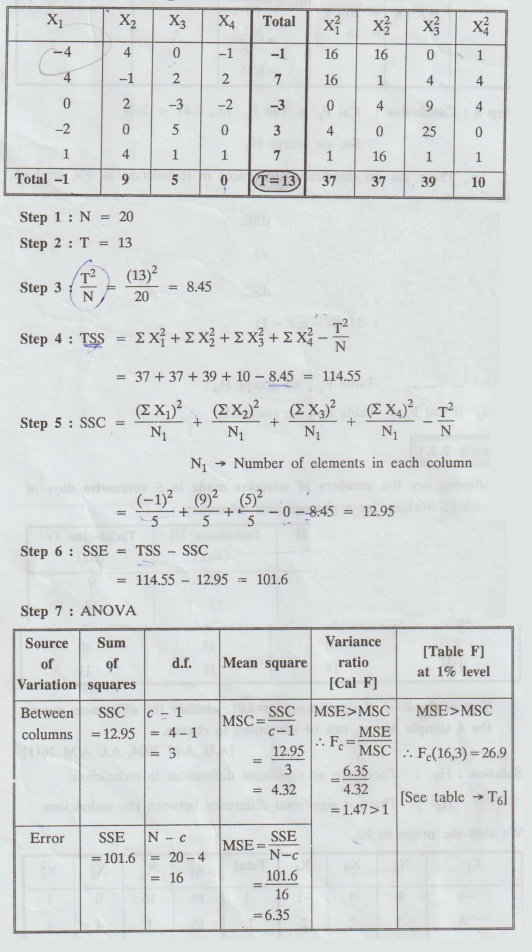
Step
8:
Conclusion: Cal Fe'< Tab Fe i.e., 1.47 < 26.9
So,
we accept H0
i.e.,
There are no significant differences in technicians at 1% level of
significance.
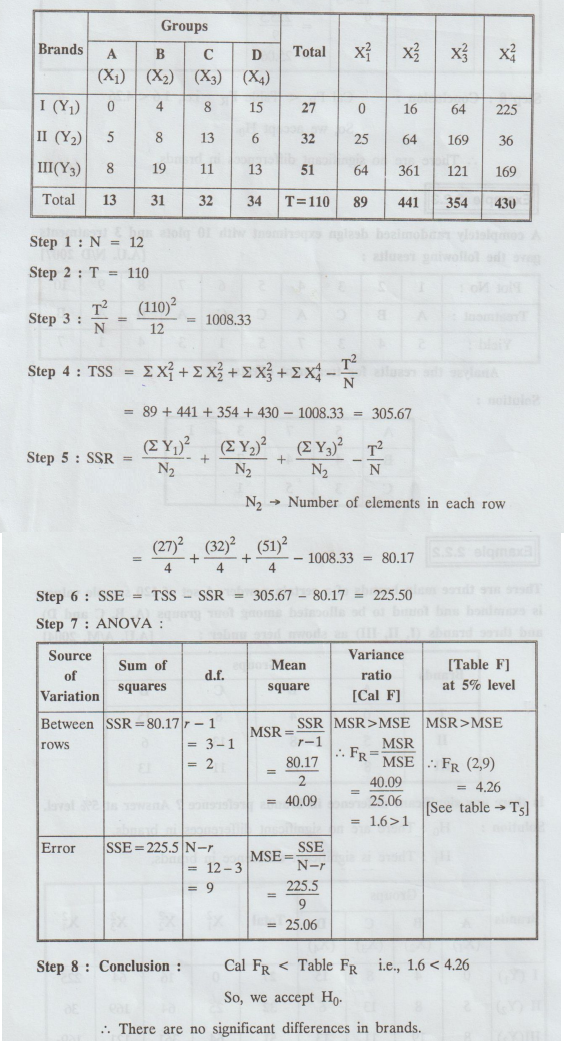
Example
2.2.2
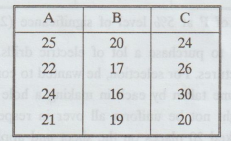
There
are three main brands of a certain powder. A set of 120 sample values is
examined and found to be allocated among four groups (A, B, C and D) and three
brands (I, II, III) as shown here under : [A.U. A/M. 2004]
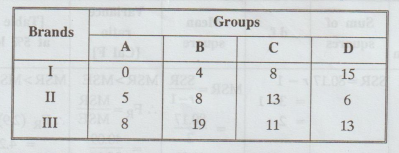
Is
there any significant difference in brands preference? Answer at 5% level.
Solution
:
H0
: There are no significant
differences in brands.
H1
: There is significant difference in brands.
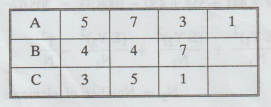
Example
2.2.3
A
completely randomised design experiment with 10 plots and 3 treatments gave the
following results : [A.U. N/D 2007]
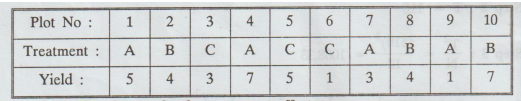
Analyse
the results for treatment effects.
Solution
:
H0
: There are no significant differences in treatments.
H1
: There is significant difference in treatments.
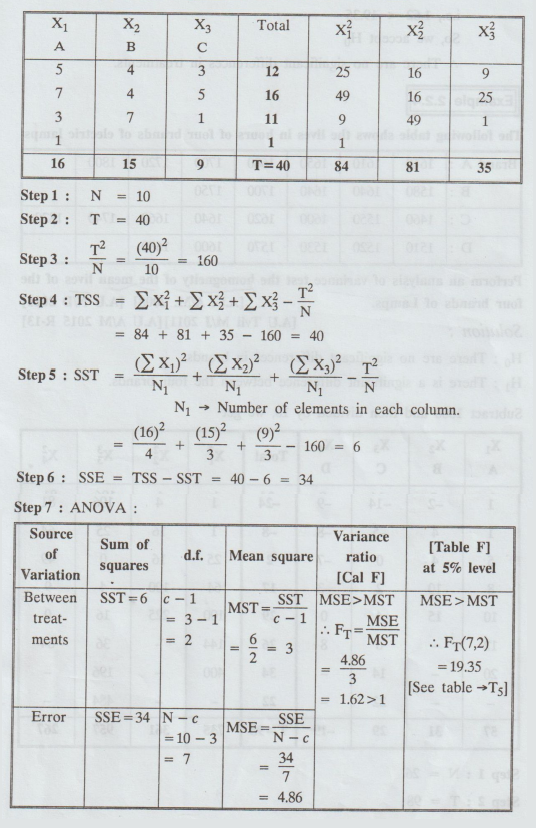
Step
8: Conclusion:
Cal
F < Table F
i.e.,
1.62 < 19.35
So,
we accept H0
There
are no significant differences in treatments.
Example
2.2.4
The
following table shows the lives in hours of four brands of electric lamps.
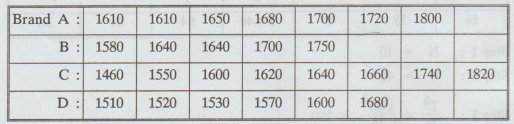
Perform
an analysis of variance test the homogneity of the mean lives of the four
brands of Lamps. [A.U. A/M. 2008] [A.U N/D 2011] [A.U Tvli M/J 2011] [A.U A/M
2015 R-13]
Solution:
H0
: There are no significant differences in brands.
H1
: There is a significant difference between the four brands.
Subtract
1600 and then divided by 10, we get
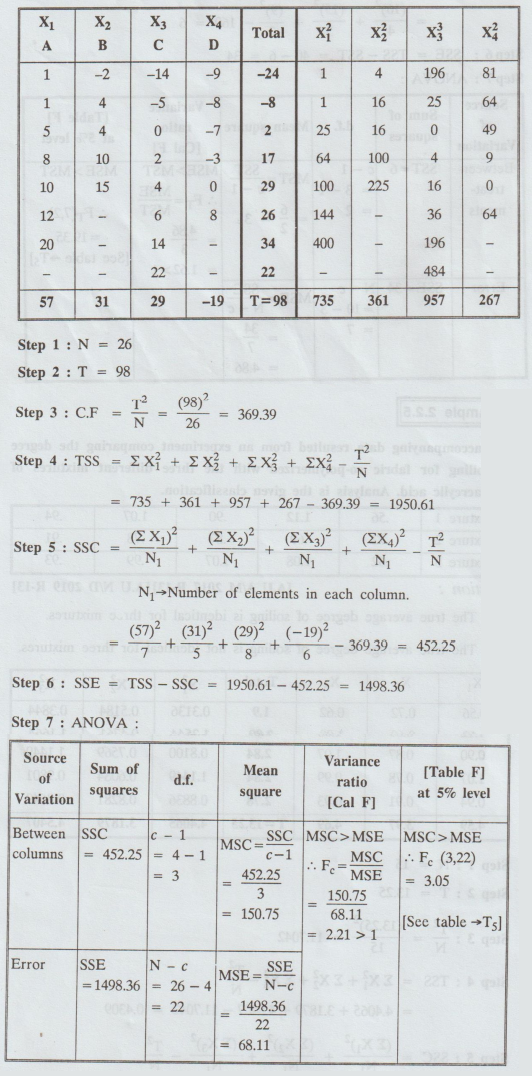
Step
8:
Conclusion: Cal Fe < Table Fe
i.e.,
2.21 < 3.05
So,
we accept H0
The
lives of the four brands of lamps do not differ significantly.
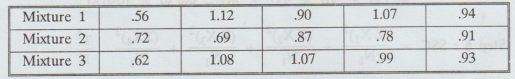
Example
2.2.5
The
accompanying data resulted from an experiment comparing the degree of soiling
for fabric co-polymerized with the three different mixtures of methacrcylic
acid. Analysis is the given classification. [A.U A/M 2017 R-13] [A.U N/D 2019
R-13]
Solution
:
H0
: The true average degree of soiling is identical for three mixtures.
H1
: The true average degree of soiling is not identical for three mixtures.
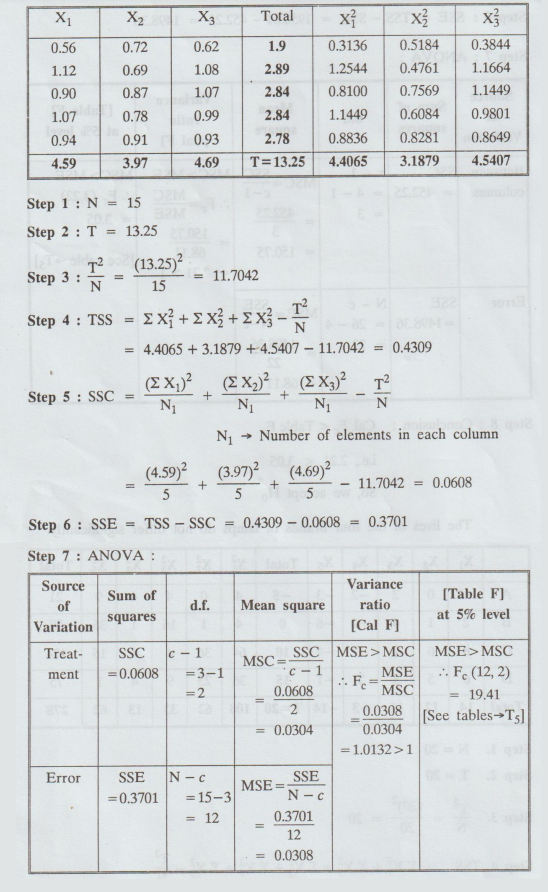
Step
8:
Conclusion: Cal Fe < Tab Fe.
i.e.,
1.0132 < 19.41
So,
we accept H0.
The
true average degree of soiling is identical for three mixtures.
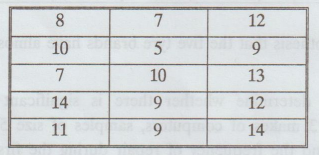
Example
2.2.6
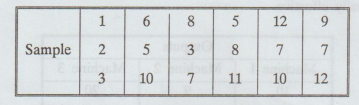
The
table shown below gives the samples got from normal population with equal
variances. Test the hypothesis that the sample means are equal to 5% and 1%
levels.
Solution
:
H0
: There is no significant difference in the means of samples.
H1
: There is significant difference in the means of samples.
Subtract
10 from each figure.
Step
8.
Conclusion:
(i) Cal F > table F, i.e., 4.927 > 3.06
So,
we reject Ho at 5% level of significance.
(ii)
Cal F > table F, i.e., 4.927 > 4.89
So,
we reject Ho at 1% level of significance.
EXERCISE 2.2
[One
Way Classification]
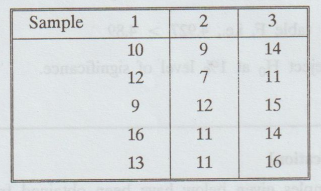
1.
The three samples given below have been obtained from three normal populations
with equal variances. Test the hypothesis that the population means are equal
at 5% level of significance.
2.
The following data give the yields, of 12 plots of land in three samples, each
of 4 plots, under three varieties of fertilizer A, B and C.
Is
there any significant difference in the average yields of land, under the three
varieties of fertilizers ?
3.
Weekly sales in Rs., in small shops in 3 towns, A, B and C are as follows.
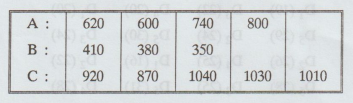
Can
we conclude that the shops in the 3 towns have the same average sales? Given
F05 (2, 9) = 4.26.
4.
Three samples of size 5 each were drawn from three uncorrelated normal
populations with equal variances. Test the hypothesis that the population means
are equal at 5% level.
5.
Three different machines are used for a production. On the basis of the outputs,
set up one-way ANOVA table and test whether the machines are equally effective.
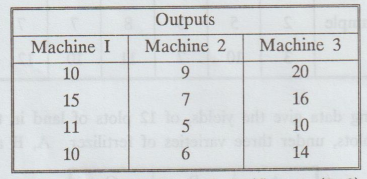
Given
that value of F at 5% level of significance (2, 9) df = 4.26.
6.
A person wanted to purchase a lot of electric drills. He got quotations from
five manufactures. For selection, he wanted to conduct an experiment to
estimate the time taken by each in making a hole in a metallic sheet. As the
sheet might not be uniform all over in respect of thickness and hardness, he
marked 20 places on the sheet and applied four drills from each concern in 4
randomly selected places to make holes. The time for marking each hole was
recorded and these formed the observations. The observations in seconds are
shown below in brackets along with marks. of the drills denoted by D1,
D2, D3 , D4 and D5.
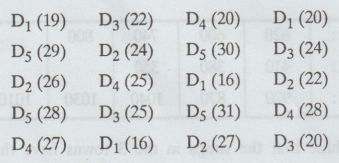
Analyse,
the given data.
7.
A car rental agency, which uses 5 different brands of tyres in the process ni)n
of deciding the brand of tyre to purchase as standard equipment for its o
fleet, finds that each of 5 tyres of each brand last the following number 20.0
of kilometers (in thousands) but is
Tyre
brands
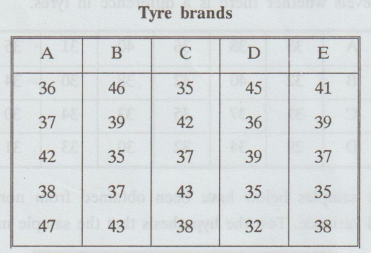
Test
the hypothesis that the five tyre brands have almost the same average life.
8.
In order to determine whether there is significant difference in the durability
of 3 makes of computers, samples of size 5 are selected from each make and the
frequency of repair during the first year of purchase 1300 is observed. The
results are as follows:
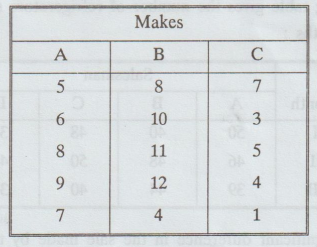
In
view of the above data. What conclusion you draw?
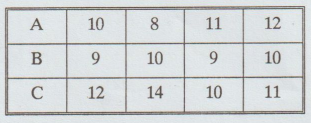
9. Table show the milk production of arbitrary units in four days with three
different cattle feed A, B and C. Analyse the results of cattle-feed brands.
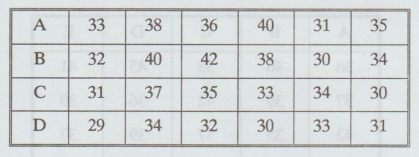
10.
A company wishes to test four different types of tyres A, B, C and D. The life
time of the tyres, as determined from their treads, are given (in Todm thousands
of miles) in the table, where each type has been tried on 6 similar automobiles
assigned at random to tyres. Test at the (i) 0.05 (ii) 0.01 levels whether
there is a difference in tyres.
11.
The three samples below have been obtained from normal population with equal
variance. Test the hypothesis that the sample means are equal:
12.
The following table gives the number of refrigerators sold by 4 salesman in
three months :
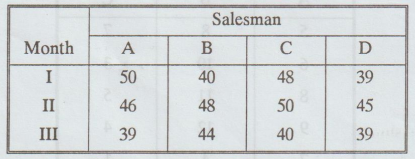
Is
there a significant difference in the sale made by the four salesman? ods.
Is
there a significant difference in the sales made during different month? lim od
[A.U. N/D 2006]
Statistics and Numerical Methods: Unit II: Design of Experiments : Tag: : Merits, Demerits, Applications, Solved Example Problems | Design of Experiments | Statistics - One Way Classification
Related Topics
Related Subjects
Statistics and Numerical Methods
MA3251 2nd Semester 2021 Regulation M2 Engineering Mathematics 2 | 2nd Semester Common to all Dept 2021 Regulation