Probability and complex function: Unit II: Two dimensional random variables
Regression
Two dimensional random variables
Regression is a mathematical measure of the average relationship between two or more variables in terms of the original limits of the data.
REGRESSION
(1)
Regression
Regression
is a mathematical measure of the average relationship between two or more
variables in terms of the original limits of the data.
(2)
Lines of regression
(1)
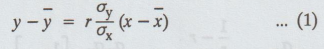
The line of regression of y on x is given byd eigns or ai 0 11
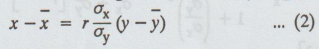
(2) The line of regression of x on y is given
by
Note:
Both the lines of regression passes through

(3)
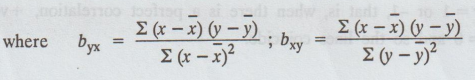
Regression coefficients
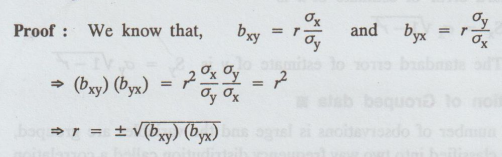
(1) Regression coefficient of y on x is r σy
/ σx = byx
(2) Regression coefficient of x on y is r σx
/ σy = bxy
Correlation
coefficient r = ± √ byx bxy
(4) Properties of Regression Lines
(1) The regression lines pass through ![]() So
So ![]() is the point of intersection of the regression lines.
is the point of intersection of the regression lines.
(2)
When r = 1, that is when there is a perfect +ve correlation or when r = -1,
that is when there is a perfect -ve correlation the equation (1) and (2)
becomes one are the same and so the regression lines coincide
(3) When r = 0 the equations of the lines are ![]() and
and ![]() which represent perpendicular lines which are parallel to the
axis.
which represent perpendicular lines which are parallel to the
axis.
(4) The slopes of the lines are r = σy /
σx , 1 σy / r σx
Since
the S.D's σx and σy are +ve, both the slopes are +ve if r
is +ve and -ve if r is -ve. That is all the three, namely the two slopes and r
are of same sign.
(5)
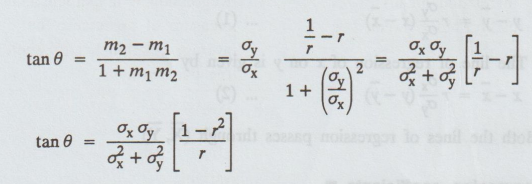
Angle between the regression lines
The
slopes of the regression lines are
m1
= r σy / σx , m2 = 1/r σy / σx
,
If
θ is the angle between the lines, then
When
will the two regression lines be (a) at right angles (b) Coincidert? [A.U N/D
2012] [A.U A/M 2019 (R13) PQT]
Note:
1. When r = 0, that is, there is no correlation between x and y.
tan
θ = ∞ (or) θ = π/2 and so the regression lines are perpendicular
2.
When r = 1 or -1, that is, when there is a perfect correlation, +ve or -ve, θ =
0 and so the lines coincide.
6.
Correlation coefficient is the geometric between the two regression
coefficients
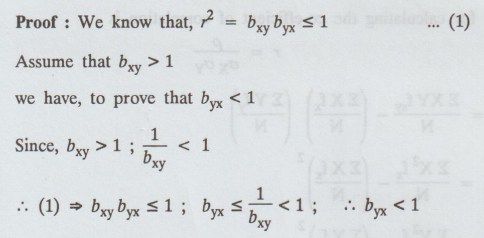
7.
If one of the regression coefficient is greater than unity the other must be
less than unity.
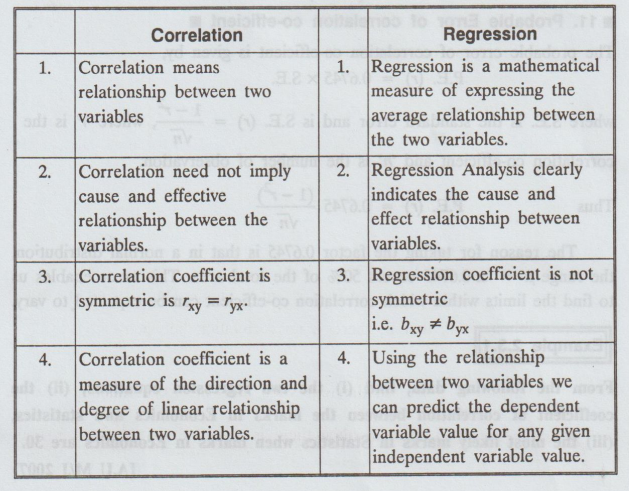
8.
Distinguisg between correlation and regression Analysis
9.
Standard errors of estimate
The
standard error of estimate of x is
(1)
Sx = σx, √1 - r2
(2) The standard error of estimate of y is Sy
= σxy√1 − r2
10.
Correlation of Grouped data
When
the number of observations is large and the variables are grouped, the data can
be classified into two way frequency distribution called a correlation table.
If there are 'n' classes for X and 'm' classes for Y, there will be (m × n)
cells in the two-way table.
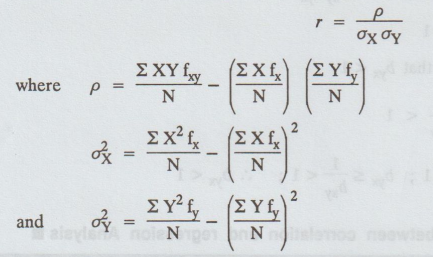
The
formula for calculating the co-efficient of correlation is
11.
Probable Error of correlation co-efficient
The
probable error of correlation co-efficient is given by,
P.E.
(r) = 0.6745 × S.E.
where
S.E. is the standard error and is S.E. (r) = 1 - r2 / √n where ‘r’ is
the correlation co-efficient and 'n' is the number of observation.
Thus
P.E. (r) = 0.6745 (1 - r2) / √n
The
reason for taking the factor 0.6745 is that in a normal distribution, the range
μ = ± 0.6745 covers 50% of the total area. This error enables us to find the
limits within which correlation co-efficient can be expected to vary.
Probability and complex function: Unit II: Two dimensional random variables : Tag: : Two dimensional random variables - Regression
Related Topics
Related Subjects
Probability and complex function
MA3303 3rd Semester EEE Dept | 2021 Regulation | 3rd Semester EEE Dept 2021 Regulation