Transmission and Distribution: Unit III: (a) Mechanical Design of Transmission Lines
Stringing Chart
instead of solving the cubic equation, it is possible to obtain the graph of tension in kg against temperature in °C and the graph of sag in metres against temperature in °C. Such graph is called stringing chart.
Stringing Chart
We have seen in the earlier section that
the tension T2 at the time of erection is given
by,
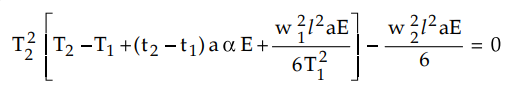
It is a cubic equation and is very
difficult and time consuming to solve.
The use of T2 is to obtain
sag at the time of erection given by,
S2 = w2l2
/ 2T2
So instead of solving the cubic
equation, it is possible to obtain the graph of tension in kg against
temperature in °C and the graph of sag in metres against temperature in °C.
Such graph is called stringing chart. The stringing chart is shown in the Fig.
4.8.1.
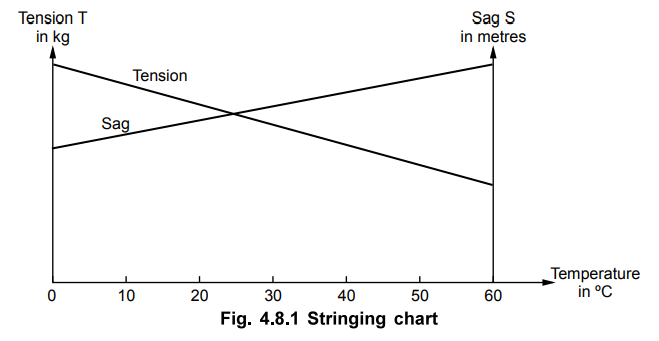
The stringing chart is very useful to
find the tension and the sag at any temperature and the loading conditions when
these values at any other temperature and the loading conditions are known to
us.
In some cases instead of tension T, the
stress f is plotted against the temperature as an independent variable. Knowing
the area of cross-section 'a', the tension T can be obtained knowing the value
of 'f from the stringing chart.
Review Question
1. Write a note on stringing chart and its applications.
Transmission and Distribution: Unit III: (a) Mechanical Design of Transmission Lines : Tag: : - Stringing Chart
Related Topics
Related Subjects
Transmission and Distribution
EE3401 TD 4th Semester EEE Dept | 2021 Regulation | 4th Semester EEE Dept 2021 Regulation