Linear Integrated Circuits: Unit II: Characteristics of Op-amp
Voltage Transfer Curve of Op - amp
The graph of output voltage Vo plotted against the differential input voltage Vd ; assuming gain constant is called voltage transfer curve or characteristics of op-amp.
Voltage Transfer Curve of Op - amp
The
graph of output voltage Vo plotted against the differential input voltage Vd
; assuming gain constant is called voltage transfer curve or characteristics of
op-amp.
1. Idea Voltage Transfer Curve
Ideally
open loop gain of op-amp is ∞
AOL
= Vo / Vd = ∞
Vd
= Vo / ∞ = 0
Thus
for zero input, the output of op-amp is always at saturation level ± Vsat
, due to infinite gain. Thus voltage transfer curve for ideal op-amp is a
vertical line as shown in the Fig. 2.16.1.

Thus
ideally range of input for linear operation of the op-amp is zero.
2. Practical Voltage Transfer Curve
Practically
AOL is finite for the op-amp. For op-amp 741C, it is 2 ×10⁵.
Vo
= AOLVd
±Vsat
= 2 × 10⁵ Vd
The
saturation voltages are almost ± 15 V.
Vd = ±15 / 2 ×105 = ± 75 µV
Hence
practically till Vd is between - 75 µV and + 75 µV, the output will
vary linearity with input. But once Vd exceeds ± 75 µV, the output
is saturated.
Thus
the practical voltage transfer curve is as shown in the Fig. 2.16.2.
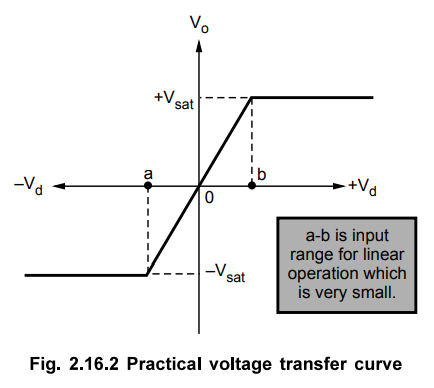
Thus,
i)
If Vd is greater than corresponding to b, the output attains + Vsat.
ii)
If Vd is less than corresponding to a, the output attains - Vsat
.
iii)
Thus range a-b is input range for which output varies linearity with the input.
But as AOL is very high, practically this range is very small.
Review Question
1. What is voltage transfer curve of an op-amp ? Explain.
Linear Integrated Circuits: Unit II: Characteristics of Op-amp : Tag: : - Voltage Transfer Curve of Op - amp
Related Topics
Related Subjects
Linear Integrated Circuits
EE3402 Lic Operational Amplifiers 4th Semester EEE Dept | 2021 Regulation | 4th Semester EEE Dept 2021 Regulation