Statistics and Numerical Methods: Unit I: Testing of Hypothesis
F-distribution [Test for equality of variances]
Solved Example Problems | Testing of Hypothesis | Statistics
The development of a test procedure for these hypothesis requires a new probability distribution called F distribution.
F-distribution [Test for equality of variances]
[Snedecor's F-distribution]
1. The F-distribution
Suppose
that two independent normal populations are of interest, when the population
means and variances, say µ1, µ2 , σ21
and σ22, are unknown. We wish to test hypothesis about
the equality of the two variances, say, H0 : σ21 =
σ22 Assume that two random samples of size n2 from
population 2 are available, and let S21 and S22
be the sample variances. We wish to test the hypothesis.
H0
: σ21 = σ22
H1
: σ21 ≠ σ22
The
development of a test procedure for these hypothesis requires a new probability
distribution called F distribution.
If
S21 and S22 are the variances of
two samples of sizes n1 and n, respectively, the estimates of the population
variance based on these samples are respectively
S21 = n1 S21 / n1 – 1 and S22 = n2 S22 / n2 – 1
The
quantities v1 = n1 -1 and v2 = n2 -1 are called the degrees of freedom of these
estimates. We want to test if these estimates S21 and S22
are significantly different or if the samples may be regarded as drawn
from the same population or from two populations with same variance σ2.

If
S21 = S22, then F = 1. Hence, our
object is to find how far any observed value of F differs from unity,
consistent with our assumption of the equality of the population variances.
The
area of the curve y f(F) to the right of Fo gives the probability that F > F0.
Here, F0 is the critical value of F. If F > F0 the difference of variances is significant. If
F < F0, the difference is not significant.
The
critical values of F, say F0, is got from F-table corresponding to
degrees of freedom (v1, v2) at a level of significance.

If
F < F0, critical value, the difference is not significant and if F
> F0, the difference is significant.
Note.
F > 0 always.
Applications
:
(i)
. -F-test is used to test (i) whether two independent samples have been drawn
from the normal populations with the same variance σ2, or
(ii)
whether the two independent estimates of the population variance are
homogeneous or not.

2. Properties of the
F-distribution
1.
The probability curve of the F-distribution is roughly sketched below.

2.
The square of the t-variate with n degrees of freedom follows a F-distribution
with l and n degrees of freedom.
3.
The mean of the F-distribution is V2 / V2 -2 (V2
> 2)
4.
The variance of the F-distribution is

Note
:
1.
We should always make F > 1. This is done by taking the larger of the two
estimates of σ2 as σ21 and by assuming that
the corresponding degree of freedom as V1.
2.
To test if two small samples have been drawn from the same normal population,
it is not enough to test if their means differ significantly or not, because in
this test we assumed that the two samples came from the same population or from
populations with equal variance. So, before applying the t-test for the
significance of the difference of the sample means, we should satisfy ourselves
about the equality of the population variances by F-test.
Example
1.5.1
A
group of 10 rats fed on diet A and another group of 8 rats fed on diet B,
recorded the following increase in weight.

Find
if the variances are significantly different. [A.U N/D 2011] [A.U A/M 2015
R-13] [A.U N/D 2013 R-13]
Solution:
Given:
n1 = 10, n2 = 8
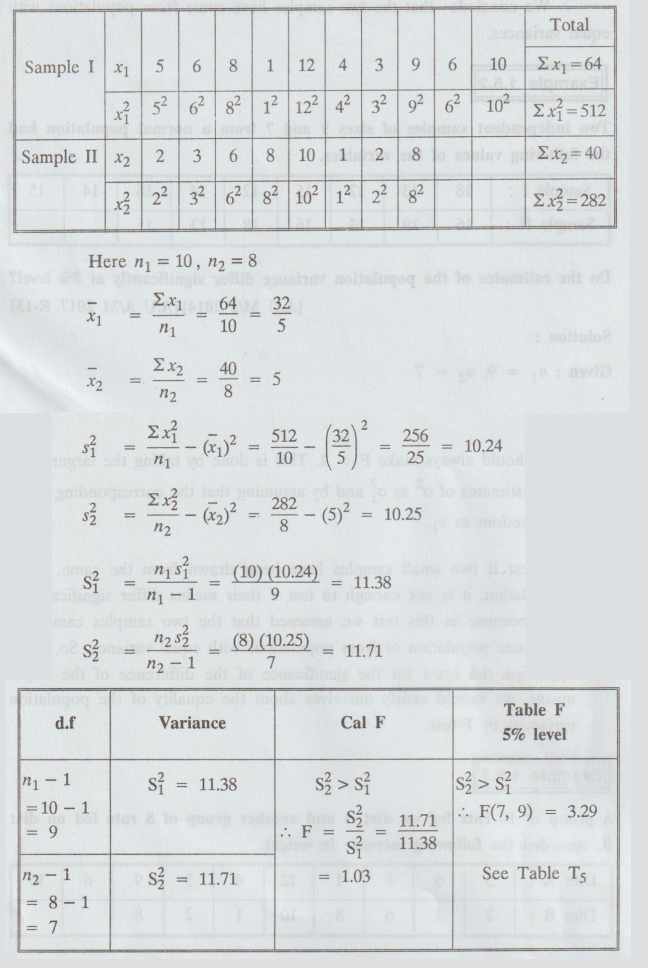
Here
Cal F < table F
i.e.,
1.03 < 3.29
We
conclude that the two samples have come from populations with equal variances.
Example
1.5.2
Two
independent samples of sizes 9 and 7 from a normal population had the following
values of the variables.

Do
the estimates of the population variance differ significantly at 5% level? [A.U
M/J 2014] [A.U A/M 2017 R-13]
Solution
:
Given:
n1 = 9, n2 = 7
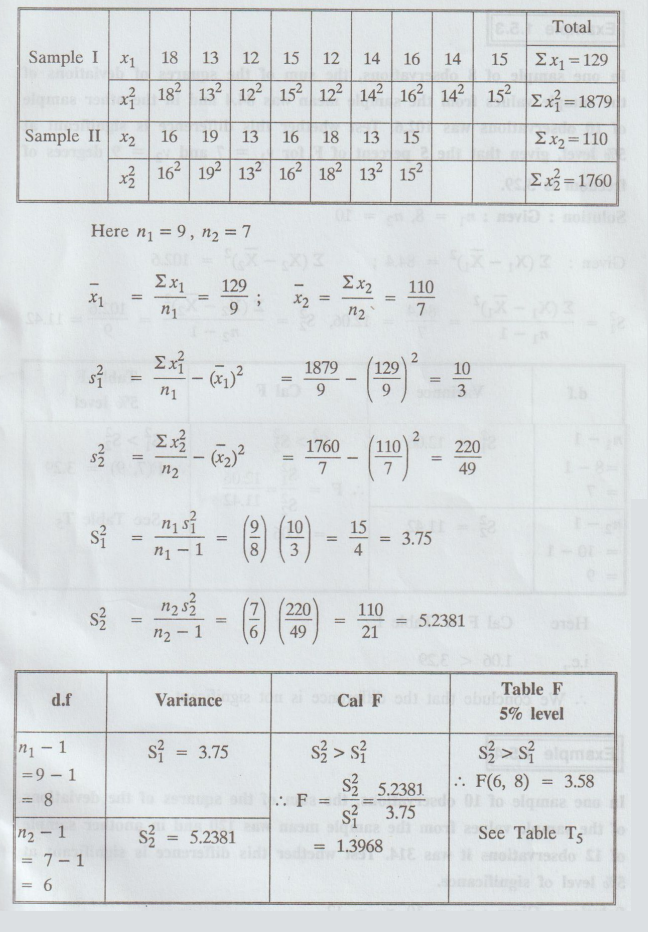
Here
Cal F < table F
i.e.,
1. 3968 < 3.58
We
conclude that the difference is not significant.
Example
1.5.3
In
one sample of 8 observations, the sum of the squares of deviations of the
sample values from the sample mean was 84.4 and in the other sample of 10
observations was 102.6. Test whether this difference is significant at 5%
level, given that the 5 percent of F for v1 = 7 and v2 = 9 degrees of freedom
is 3.29.
Solution:
Given: n1 = 8, n2 = 10

Here
Cal
F < Table F
i.e.,
1.06 < 3.29
We
conclude that the difference is not significant.
Example
1.5.4
In
one sample of 10 observations, the sum of the squares of the deviations of the
sample values from the sample mean was 120 and in another sample of 12
observations it was 314. Test whether this difference is significant at 5%
level of significance.
Solution:
Given: n1 = 10, n2 = 12

Here
Cal
F < Table F
i.e.,
2.14 < 3.11
We
conclude that the samples might have come from two populations having the same
variance.
Example
1.5.5
Two
random samples give the following results

Test
whether the samples could have come from the same normal population. [A.U M/J
2006, M/J 2012] [A.U N/D 2016 R-13]
Solution:
A normal population has two parameters namely
the mean μ and the variance σ2 . If we want to test the samples from
the same normal population, we have to test
(i)
the equality of population variances (using F-test)
(ii)
the equality of population means (using t-test)
Since
t-test σ21 = σ22 assumes we shall
first apply F-test and then t-test.
(i)
F - test

Here
Cal F < Table F
i.e.,
1.02 < 2.90
[Note:
If F-test failed, then t-test should not be used]
We
conclude that the samples might have come from two populations having the same
variance.

Example
1.5.6
Two
samples of sizes 9 and 8 give the sum of the squares of deviations from their
respective means equal to 160 and 91 respectively. Can they be regarded as
drawn from the same normal population?
Solution:
Given:
n1 = 9, n2 = 8

Here
Cal F < Table F
i.e.,
1.54 < 3.73
We
conclude that the samples might have come from two populations having the same
variance.
Example
1.5.7
An
instructor has two classes A and B, in a particular subject, class A has 16
students while class B has 25 students. On the same examination, although these
was no significant difference in mean grade class A has standard deviation of
9, while class B had a standard deviation level of 12. Can we conclude at the
0.01 level of significance that the variability of class B is greater than that
of class A. [A.U N/D 2020, A/M 2021 R-17]
Solution
:
Given:
n1
= 16, s1 = 9
n2
= 25, s2 = 12

6.
Conclusion:
Here,
Cal F < Table F
i.e.,
1.736 < 3.325
So,
we accept H0 at 1% level of significance.
EXERCISES 1.5
1.
Two random samples drawn from two normal populations are :
Obtain
estimates of the variances of the populations and test whether the populations
have the same variance.
[Ans.
They have same variances]
2.
Two random samples of sizes 8 and 7 had the following values of the variables.

Do
the estimates of population variance differ significantly?
[Ans.
Not significant] [A.U Tvli M/J 2011] [A.U A/M 2015 R-8]
3.
Two random samples drawn from two normal populations have the variable values
as below:

Obtain
the estimates of the variances of the population and test whether the two
populations have the same variance.
4.
In two groups of 10 persons each, the increases in weight due to two different
diets in the same period were in kgs.

Find
whether the variances are significantly different.
[Ans.
Not significant]
5.
The nicotine contents in two samples (random) of tobacco are given below:

Can
you say that the two samples came from the same population?
[Ans.
F = 4.07, variances are equal
|t|
= 1.92, not significant; came from same population]
6.
The time taken by labourers in performing a job by two different ways are given
below:
Test
for the difference of variances of the populations. [A.U N/D 2012]
[Ans.
Not significant]
7.
The two random samples reveal the following data:

Test
whether the samples come from the same normal population.
[Ans. F = 1.05; |t| = 9.73]
8.
Two random samples reveal the following data. Test for the variance equality of
the populations.

9.
The following data relate to a random sample of government employees woled an
onlsy aldertry in two states of the Indian Union.
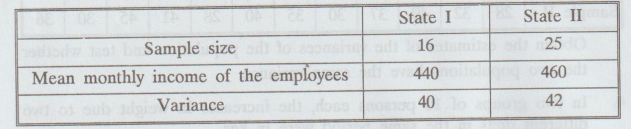
Test
whether the samples come from the same normal population.
[Ans. F 1.05; t = 9.73]
10.
Two samples were drawn independently from two normal populations.
The
data are :

Test
whether the population variances are equal.
[Ans.
F=1.154]
11.
The random samples were drawn from two normal populations and the following
results were obtained.

Obtain
estimates of the variances of populations and test whether the two populations
have the same variances.
[Ans.
σ21 = σ22
; F = 1.935, Not significant]
12.
Two samples are drawn from the two normal populations. From the following data
test whether the two samples have the same variance at 5% level.

[Ans. σ21 = σ22
; F = 1.467]
13.
Two methods of performing a certain operation are compared. The following data
are obtained.

Test
the hypothesis that the two variances are equal at 5% level of significance.
Statistics and Numerical Methods: Unit I: Testing of Hypothesis : Tag: : Solved Example Problems | Testing of Hypothesis | Statistics - F-distribution [Test for equality of variances]
Related Topics
Related Subjects
Statistics and Numerical Methods
MA3251 2nd Semester 2021 Regulation M2 Engineering Mathematics 2 | 2nd Semester Common to all Dept 2021 Regulation