Statistics and Numerical Methods: Unit I: Testing of Hypothesis
Large sample test (Normal distribution) for single mean
Solved Example Problems | Testing of Hypothesis | Statistics
If the size of the sample n > 30, then that sample is called large sample.
Large sample test
Large sample test (Normal distribution) for single mean
If
the size of the sample n > 30, then that sample is called large sample.
1. Tests on the mean of a Normal distribution, if σ is known.
If
x1, x2,...,xn is a random sample of size n
from a normal population with mean µ and s.d σ, then the sample mean is ![]() and s.d is σ/√n
and s.d is σ/√n
Thus,
the standard normal variate corresponding to ![]() is
is

Set
up a null hypothesis H0 : μ = μ0 and
Alternative
hypothesis H1 : μ ≠ μ0 where μ0 is a specified
constant.
2. Tests on the mean of a Normal distribution,
if σ is unknown.
We
can use its estimate of the sample s.d as σ = s and the test statistic

Note: General procedure
for Hypothesis tests [A.U N/D 2014]
1. From the problem
context, identify the parameter of interest.
2. State the null
hypothesis, Ho.
3. Specify an
appropriate alternative hypothesis, H1
4. Choose a
significance level a.
5. Determine an
appropriate test statistic.
6. State the rejection
region for the statistic.
7. Compute any
necessary sample quantities, substitute these into the equation
for the test
statistic, and compute the value.
8. Conclusion: Decide whether or
not, Ho should be rejected and report that in the problem context.
Working
Procedure :
For
the large sample (n> 30), to test whether the population mean μ equals to a
constant μ0 or not.
1.
Null hypothesis H0:
μ = μ0
(i)
If we want to test the significance of the difference between ![]() and μ, then we set up the null hypothesis H0 : μ =
and μ, then we set up the null hypothesis H0 : μ = ![]() [the difference is not significant]
[the difference is not significant]
(ii)
If we want to test any statement about the population, then we set up the null
hypothesis, that is true.
For
example, if we want to find the population mean has specified value µ0,
then H0 : µ = µ0
2.
Alternative hypothesis H1:
u
≠ μ0 (two-tailed) (or)
μ
> μ0 one-tailed (right) (or)
μ
< μ0 one-tailed (left)
(i)
Suppose, the average life of the company bulbs has been estimated (µ) 3000 hours.
We take a sample from the population and suppose the sample mean is
(![]() ) 2950 hours. We want to decide whether the mean life time has
changed.
) 2950 hours. We want to decide whether the mean life time has
changed.
Here,
H0 : μ = 3000
H1
: μ ≠ 3000 [two-tailed test]
(ii)
The mean life of bulbs to be atleast 3000 hours and the sample mean is 2950
hours.
Here,
H0 : µ = 3000
H1
μ < 3000 [one-tailed test (left)]
(iii)
The mean life of bulbs more than 3000 hours and the sample mean is 2950 hours.
Here,
Ho:
μ = 3000
H1
μ > 3000 [one tailed test (right)]
3.
Level significant : ɑ
4.
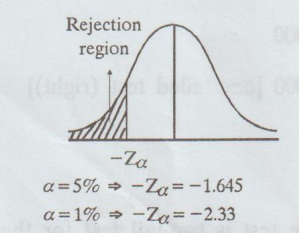
Critical region:
(a)
If u ≠ μ0, then the test is two-tail test for the given ɑ.
The
critical values are -Zɑ/2 and Zɑ/2

(b)
If µ > µ0, then the test is one-tailed test (right) for the given
ɑ.
The
critical value is Zɑ

(c)
If µ < µ0, then the test is one-tailed test (left) for the given ɑ.
The critical value is -Zɑ
5.
The test statistic
[For
large sample s nearly equal to σ]
where
![]() → mean of the sample
→ mean of the sample
μ
→ population mean
σ
→ population standard deviation
n
→ sample size.
6.
Conclusion:
(a) If - Zɑ/2 < Z < Z ɑ/2,
then we accept H0 for two-tailed test; otherwise, reject H0.
(b) If Zɑ > Z, then we accept H0 for
one-tailed test (right); otherwise, reject H0.
(c)
If - Zɑ < Z, then we accept Ho for one-tailed test (left);
otherwise, reject H0.
Example
1.2a(1).
A
sample of 900 members has a mean 3.4 cm and standard deviation 2.61 cm. Is the
sample from a large population of mean 3.25 cms and standard deviation of 2.61
cms? (Test at 5% level of significance. The value of z at 5% level is | Zɑ
| < 1.96) [A.U M/J 2010] [A.U A/M 2010 (R-08)] [A.U N/D 2016 (R13)]
Solution:
Given: n = 900, μ = 3.25, s = 2.61, ![]() = 3.4, ɑ = 5%
= 3.4, ɑ = 5%

Example
1.2.a(2)
The
mean life time of a sample of 100 light bulbs produced by a company is computed
to be 1570 hours with a standard deviation of 120 hours. If μ is the mean life
time of all the bulbs produced by the company, test the hypothesis μ = 1600
hours, against the alternative hypothesis μ 1600 hours with ɑ = 0.05 and 0.01. [A.U.
A/M 2003] [A.U N/D 2020 & 2021 (R-17)] 1600, s = 120, x = 1570,
Solution
:
Given:
n = 100, μ = 1600 s = 120 ![]() = 1570, α = 0.05 and α = 0.01
= 1570, α = 0.05 and α = 0.01

Example
1.2a (3).
The
mean breaking strength of the cables supplied by a manufacturer is 1800 with a
S.D. of 100. By a new technique in the manufacturing process, it is claimed
that the breaking strength of the cable has increased. In order to test this
claim, a sample of 50 cables is tested and it is found that the mean breaking
strength is 1850. Can we support the claim at 1% level of significance ?
Solution:
Given:
n = 50, μ = 1800, s = 100, ![]() = 1850, ɑ = 1%
= 1850, ɑ = 1%

6.
Conclusion :
Here
Cal Z > table Z
i.e.,
3.54 > 2.33
So,
we reject H0.
i.e.,
We may support the claim of increase in breaking strength.
Example
1.2a(4).
A
normal population has a mean of 6.48 and s.d of 1.5. In a sample of 400 members
mean is 6.75. Is the difference significant ?
Solution
:
Given:
n = 400, μ = 6.48, s = 1.5, ![]() = 6.75
= 6.75

Example
1.2.a(5)
The
average number of defective articles per day in a certain factory is claimed to
be less than the average of all the factories. The average of all the factories
is 30.5. A random sample of 100 days showed the following distribution.

Is
the average less than the figure for all the factories ?
Solution
:

Example
1.2.a(6)
A
sample of 100 people during the past year showed an average life span of 71.8
years. If the s.d. of the population is 8.9 years, test whether the mean life
span today is greater than 70 years. [A.U. 2009]
Solution:
Given:
n = 100, ![]() = 71.8, μ = 70, σ = 8.9
= 71.8, μ = 70, σ = 8.9

Example
1.2.a(7)
The
guaranteed average life of a certain type of electric light bulbs is 1000 hours
with a standard deviation of 125 hours. It is decided to sample the output so
as to ensure that 90 percent of the bulbs do not fall short of the guaranteed
average by more than 2.5%. What must be the minimum size of the sample? [A.U
CBT A/M 2011]
Solution:
Here
μ= 1000 hours, σ = 125 hours.
Since,
we do not want the sample mean to be less than the guaranteed average mean (u=
1000) by more than 2.5%, we should have

Let
n be the given sample size. Then,

According
to the given condition, we have
P
(Z > - √n/5) = 0.90 ⇒ P
(0 < Z < √n/5) = 0.40
√n/5
= 1.28 (From Normal probability tables)
⇒ > n = 25 × (1.28)2
= 41 approximately
Example
1.2.a(8)
A
survey is proposed to be conducted to know the annual earnings of the old
Statistics graduates of Delhi University. How large should the sample to taken
in order to estimate the mean annual earnings within plus and minus Rs. 1,000
at 95% confidence level? The standard deviation of the annual earnings of the
entire population is known to be Rs. 3,000.
Solution:
Given: σ = Rs. 3,000

We
know that, in sampling from normal population or for large samples from any
population 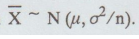 Hence, from normal probability tables, we have:

Example
1.2a (9)
A
normal population has a mean 0.1 and S.D 2.1. Find the probability that mean of
a sample of size 900 will be negative.
Solution:
Given:
μ = 0.1, s = 2.1, n = 900

Statistics and Numerical Methods: Unit I: Testing of Hypothesis : Tag: : Solved Example Problems | Testing of Hypothesis | Statistics - Large sample test (Normal distribution) for single mean
Related Topics
Related Subjects

Statistics and Numerical Methods
MA3251 2nd Semester 2021 Regulation M2 Engineering Mathematics 2 | 2nd Semester Common to all Dept 2021 Regulation