Statistics and Numerical Methods: Unit I: Testing of Hypothesis
Large sample test for difference of proportions
Solved Example Problems | Testing of Hypothesis | Statistics
Suppose we want to compare 2 district populations with regard to possession of an attribute. Let a sample of size n1 be chosen from the first population and another sample of size n2 be chosen from the second population.
Large sample test for difference of proportions
Suppose
we want to compare 2 district populations with regard to possession of an
attribute. Let a sample of size n1 be chosen from the first
population and another sample of size n2 be chosen from the second population.
Let X1 be the number of persons possessing the attribute A in the first
sample and let X2 be the number of persons possessing the same
attribute in the second sample.
Then
p1 = X1 / n1 p2
= X2 / n2
As
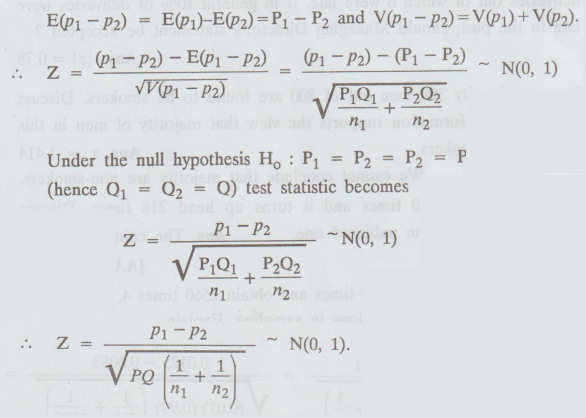
before E(p1) = P1 and E(p2 ) = P2
where P1 and P2 are the proportions in the populations.
V(p1
) = P1 Q1 / n1 and V(p2) = P2
Q2 / n2
Since
for large samples p1 and p2 are asymptotically normally
distributed P1-P2 is also normally distributed, and also
v
An
unbiased estimate of population proportion P based on both the samples is given
by P = n1p1 + n2p2 / n1+
n2 Suppose the population proportions
P1
and P2 are given to be different. (i.e.,) P1 ≠ P2.
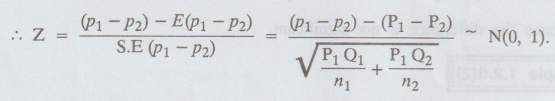
If we want to test whether the difference P1 - P2 is
significant then the test statistic becomes
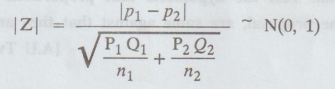
Here
sample proportions are not given. If we set up a null hypothesis Ho: P1 P2 then
test statistic becomes
Example
1.2.d(1)
During
a country wide investigation the incidence of TB was found to be 1%. In a
college of 400 strength 5 were reported to be affected whereas in another
college of 1200 strength 10 were reported to be affected. Does this indicate
any significant difference.
Solution:
Given:
P
= 1% 1 / 100 = 0.01; Q = 1 - 0.01 = 0.99
n1=400;
n2=1200; P1 5/400 =0.0125; P2 = 10 / 1200 = 0.0083
1.
Ho : P1 = P2 [no significant difference]
2.
H1 : P1 ≠ P2
3.
α = 0.05
4.
Table value
|Z|
= 1.96 at 5% level.
5.
Calculate :
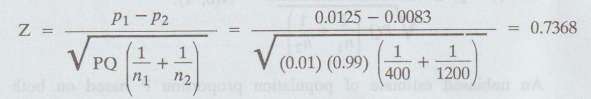
6.
Conclusion:
Here,
Cal Z < table Z
i.e.,
0.7368 < 1.96
So,
we accept H0 at 5% level of significance.
Hence
the difference is not significant.
Example
1.2.d (2)
Random
samples of 400 men and 600 women were asked whether they would like to have a
flyover near their residence. 200 men and 325 women were in favour of the
proposal. Test the hypothesis that proportions of men and women infavour of the
proposal, are same against that they are not, at 5% level. [A.U Tvli M/J 2011]
Solution:
Given:

6.
Conclusion:
Here,
Cal Z < table Z
i.e.,
1.269 < 1.96
So,
we accept Ho at 5% level of significance.
Hence
we may conclude that men and women do not differ significantly as regards
proposal of flyover is concerned.
Example
1.2.d(3) d
A
company has the head office at Calcutta and a branch at Bombay. The personnel
director wanted to know if the workers at the two places would like the
introduction of a new, plan of work and a survey was conducted for this
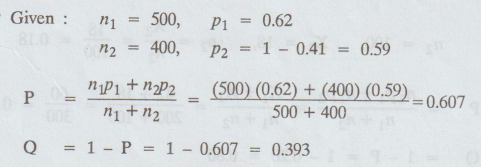
purpose. Out of a sample of 500 workers at Calcutta, 62% favoured the new plan.
At Bombay out of a sample of 400 workers, 41% were against the new plan. Is
there any significant difference between the two groups in their attitude
towards the new plan at 5% level.
Solution:
Given:
1.
H0 P1 = P2 [there is no significant difference
between the two groups in their attitude towards the new plan]
2.
H1 : P1 ≠ P2 [Two-tailed]
3.
ɑ = 0.05
4.
Table value |Z| = 1.96
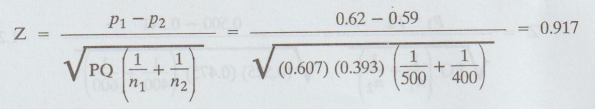
5.
Calculate :
6.
Conclusion:
Here,
Cal Z < table Z
i.e.,
0.917 < 1.96
So,
we accept Ho at 5% level of significance.
Hence
we conclude that there is no significant difference between the two groups in
their attitude towards the new plan.
Example
1.2.d(4)
A
cigarette manufacturing firm claims that its brand A of the cigarettes outsells
its brand B by 8%. If it is found that 42 out of a sample of 200 smokers prefer
brand A and 18 out of another random sample of 100 smokers prefer brand B, test
whether the 8% difference is a valid claim. (use 5% level of significance).
Solution:
Given:
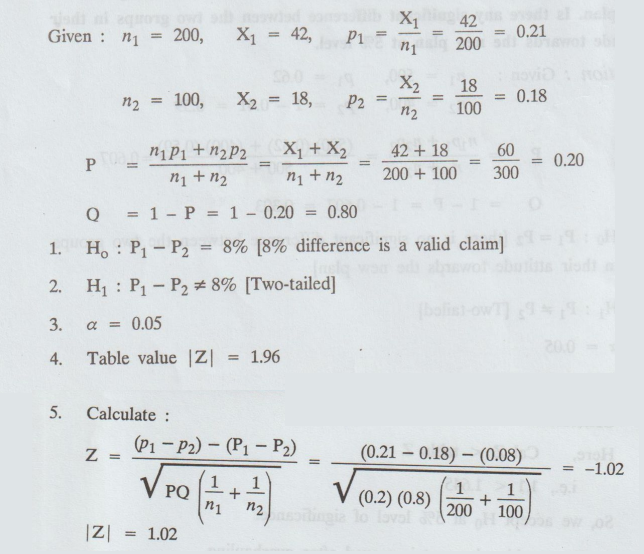
6.
Conclusion :
Here,
Cal Z < table Z
i.e.,
1.02 < 1.96
So,
we accept Ho at 5% level of significance.
Hence
we may conclude that a difference of 8% in the sale of two brands of cigarettes
is a valid claim by the firm.
Example
1.2.d(5)
A
machine produced 20 defective units in a sample of 400. After overhauling the
machine, it produced 10 defective units in a batch of 300. Has the machine
improved in production due to overhauling. Test it at 5% level of significance.
[A.U. May 2001]
Solution:
Given:
n1 = 400, n2 = 300

6.
Conclusion :
Here,
Cal Z < table Z
i.e.,
1.1 < 1.645
So,
we accept Ho at 5% level of significance.
The
machine has not improved after overhauling.
Example
1.2.d(6)
In
two large populations, there are 30 and 25 per cent respectively of blue-eyed
people. Is this difference likely to be hidden in samples of 1,200 and 900
respectively from the two populations ?
Solution:
Given:
n1 = 1200, n2 = 900
P1
= Proportion of blue-eyed people in the first population
=
30% = 0.30
P2
= Proportion of blue-eyed people in the second population
=
25% = 0.25
Q1
= 1 - P1 = 0.30 = 0.70
Q2
= 1 – P2 = 1 – 0.25 – 0.75
1.
H0 : P1 = P2,
the sample proportions are eqaul
2.
H1: P1 ≠ P2
3.
α = 5%
4.
Table value |Z| =1.96
5.
Calculate :

Conclusion:
Here,
Cal Z > table Z
i.e.,
2.56 > 1.96
So,
we reject Ho at 5% level of significance.
We
conclude that the difference in population proportions is unlikely to be hidden
in sampling.
Example
1.2.d(7)
In
a random sample of 400 students of the university teaching departments, it was
found that 300 students failed in the examination. In another random sample of
500 students of the affiliated colleges, the number of failures in the same examination
was found to be 300. Find out whether the proportion of failures in the
university teaching departments is significantly greater than the proportion of
failures in the university teaching departments and affiliated colleges taken
together.
Solution:
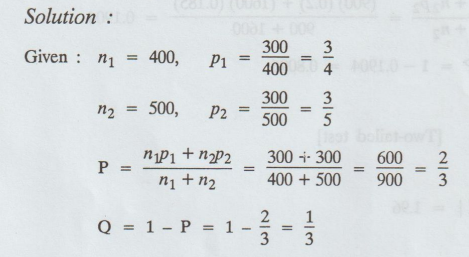
1.
H0 : P = p1 [P is
the pooled estimate]
i.e.,
proportion of failures in the university teaching departments and affiliated
colleges taken together, do not differ significantly]
2.
H1 : P ≠ P1
3.
ɑ is not given
4.
Table value |Z| = 3 (for general) [both the level of significance]
5.
Calculate :
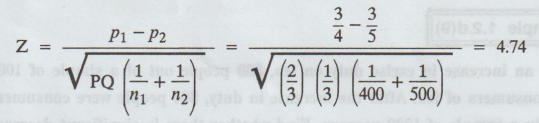
6.
Conclusion:
Here,
Cal Z > table Z
i.e.,
4.74 > 3
So,
we reject H0
We
conclude that there is significant difference between p1 and P.
Example
1.2.d(8)
In
a large city A, 20 per cent of a random sample of 900 school boys had a slight
physical defect. In another large city B, 18.5 percent of a random sample of
1600 school boys had the same defect. Is the difference between the proportion
significant?
Solution
:

6.
Conclusion:
Here
Cal Z < table 2
i.e.,
0.92 < 1.96
So,
we accept Ho at 5% level of significance.
Example
1.2.d(9)
Before
an increase in excise duty on tea, 800 people out of a simple of 1000 were
consumers of tea. After the increase in duty, 800 people were consumers of tea
in a sample of 1200 persons. Find whether there is significant decrease in the
consumption of tea after the increase in duty.
Solution
:

6.
Conclusion:
Here,
Cal Z > table Z
i.e.,
6.82 > 2.3
So,
we reject Ho at 1% level of significance.
EXERCISE 1.2(d),
1.
In a city A, 20% of a random sample of 900 school boys had a certain slight
physical defect. In another city B, 18.5% of a random sample of 1600 school
boys had the same defect. Is the difference between the not proportions
significant ?
Ans.
The difference in proportions is not significant at 5% level.
2.
In two large populations there are 30% and 25% fair haired people. Is this
difference likely to be hidden in the samples of 1200 and 900 respectively
drawn from the populations ?
Ans.
The samples do not reveal the difference in the population proportions at 1%
level
3.
In
a town A there were 956 births of which 52.5% was male. It another town B there
were 450 births and the percentage of males in the total births of A and B was
49.6. Is the difference in the proportion of A and B significant?
Ans.
The difference in the sample proportions is significant at 1% level
4.
An examining body claims that among those who passed, the girls are 8% more
than the boys. But in a sample of 200 examinees there are 42 girls who passed
and in another sample of 100 examinees there are 18 boys who passed. Test
whether the claim can be accepted or not.
Ans.
The claim can be accepted at 5% level of significance.
5.
In a random sample of 800 adults from the population of a certain large city,
600 are found to have dark hair. In a random sample of 1000 adults from the
habitants of another large city 700 are dark haired. Show that the difference
of the proportion of dark haired people is nearly 2.4 times the standard error
of the difference of above sizes.
6.
In a referendum submitted to the student body at a university. 850 men and 566
women voted. 530 of the men and 304 of the women voted yes. Does this indicate
a significant difference of opinion on the matter at 1% level between men and
women students.
Ans.
the null hypothesis is rejected at 1% level of significance yes.
7.
A machine puts out 16 imperfect articles in a sample of 500. After machine is
overhauled it puts out 3 imperfect articles in a batch of 100. Has the machine
improved?
Ans.
The machine has not improved.
8.
1000 apples kept under one type of storage were found to show rotting is to the
extent of 4%. 1500 apples kept under another kind of storage showed 3% rotting.
Can it be reasonably concluded that the second type bad av avod loodoa 0001 of
storage is superior to the first ?
Ans.
There is no significant differences between the proportion oge of rotten apples
in the two storages.
Statistics and Numerical Methods: Unit I: Testing of Hypothesis : Tag: : Solved Example Problems | Testing of Hypothesis | Statistics - Large sample test for difference of proportions
Related Topics
Related Subjects
Statistics and Numerical Methods
MA3251 2nd Semester 2021 Regulation M2 Engineering Mathematics 2 | 2nd Semester Common to all Dept 2021 Regulation