Statistics and Numerical Methods: Unit I: Testing of Hypothesis
Small sample test for difference of means
Solved Example Problems | Testing of Hypothesis | Statistics
Suppose, we want to test, if two independent samples x1, x2, … n1 and y1, y2, ... yn2 of sizes n1 and n2 have been drawn from two normal population with means μ1 and μ2 respectively.
2. Small sample test for difference of means
t-distribution
for difference of means
Suppose,
we want to test, if two independent samples x1, x2, … n1
and
y1,
y2, ... yn2 of sizes n1 and n2 have
been drawn from two normal population with means μ1 and μ2
respectively.
Under
the null hypothesis, H0 that the samples have
been drawn from the normal population with means μ1 and μ2
are under the assumption that the population variance are equal. (i.e., σ1
= σ2 = σ)

is
an unbiased estimate of the population variance σ2.
t
follows t-distribution with degrees of freedom n1 + n2 -
2.
Under
the null hypothesis H0, that (i) samples have been drawn from the
population with the same means i.e., µ1 µ2, or (ii) the
sample means ![]() and
and ![]() do not differ significantly, take the
statistic
do not differ significantly, take the
statistic

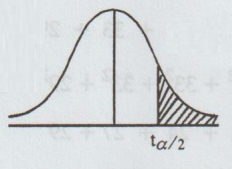
If
t < table value of t0 accept0, at a level of significance.
Assumption:
The following assumptions are made in using this test.
(i)
Parent populations, from which the samples have been drawn are normally
distributed.
(ii)
Population variances are equal and unknown
(iii)
The two samples are random and independent.

S1,
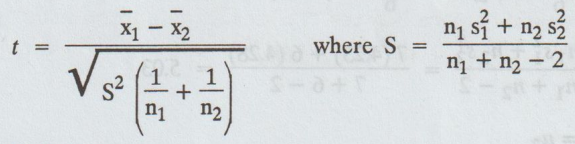
S2 are standard deviations of the two samples. Therefore, statistic
't' to be tested is

Note
2.
If the pairs of values are in some way associated (or correlated), we cannot
adopt the case under Note 1. Then, we have to find the differences of the
associated pairs of values and apply for single mean
 to test, if the means of the differences is significantly different from zero.
Then, the degree of freedom is n - 1.
to test, if the means of the differences is significantly different from zero.
Then, the degree of freedom is n - 1.

where
(xi, yi) are the paired data, i = 1,2, … n
Working
Procedure :
Concerning
difference between two means, with unknown σ21 and σ22
but equal. (σ1 = σ2 = σ). For the small samples (n1
< 30, n2 < 30) drawn from two normal population.
1.
Null hypothesis H0: µ1 = µ2
2.
Alternative hypothesis H1 : µ1 ≠ µ2 (or) µ1
> µ2
(or) µ1 < µ2
3.
Level of significance: a, d.f. = n1 + n2 - 2
4.
Critical region :
(a)
If µ1 ≠ µ2, then the test is two-tailed test for
the given ɑ.
The
critical values are -ta/2 and ta/2 from the t-distribution table with
d.f.
n1 + n2 - 2

(b)
If µ1 > µ2, then the test is one-tailed test
(right) for the given ɑ,
The
critical value is ta with d.f. n1 + n2 - 2
(c)
If µ1 < µ2, then the test is one-tailed test
(left) for the given ɑ,
The
critical value is -tɑ with d.f.= n1 + n2 - 2

5.
The test statistic
6.
Conclusion:
(a)
If - tɑ/2 < t < t ɑ/2,
then we accept H0 for two-tailed test; otherwise, we reject H0
(b)
If t < tɑ, then we accept H0 for one-tailed test (right);
otherwise, we reject H0
(c)
If -ta < tɑ, then we accept H0 for one-tailed test
(left); otherwise, we reject H0
Example
1.3b(1)
Two
horses A and B were tested according to the time (in seconds) to run a
particular race with the following results :

6.
Conclusion:
Here,
Cal t > table t
i.e.,
2.5 > 1.796
So,
we reject H0 at 5% level of significance.
Example
1.3b(2)
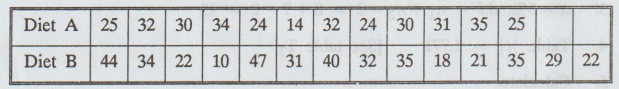
A
group of 10 rats fed on diet A and another group of 8 rats fed on diet B,
recorded the following increase in weight (gms).
Diet
A: 5, 6, 8, 1, 12, 4, 3, 9, 6, 10
Diet
B: 2, 3, 6, 8, 10, 1, 2, 8
Does
it show superiority of diet A over diet B.
Solution:
Given:
n1 = 10, n2 = 8

6.
Conclusion:
Here,
Cal t < table t
i.e.
0.869 < 1.75
So,
we accept Hɑ.
Hence,
the difference is not significant, so we cannot conclude that diet A is
superior to diet B.
Example
1.3b(3)
The
following are the number of sales which a sample of 9 sales people of
industrial chemicals in Gujarat and a sample of 6 sales people of industrial
chemicals in Maharashtra made over a certain fixed period of time:

Assuming
that the population sampled can be approximated closely with normal
distributions having the same variance, test the null hypothesis μ1 - μ2 = 0
against the alternative hypothesis μ1 – μ2 ≠ 0 at the
0.01 level of signifance. [A.U N/D 2009]
Solution:
Given: n1 = 9, n2 = 6

6.
Conclusion:
Here,
Cal t < table t
i.e.,
1.03 < 3.012
So,
we accept H0 at 1% level of significance.
Example
1.3b (4)
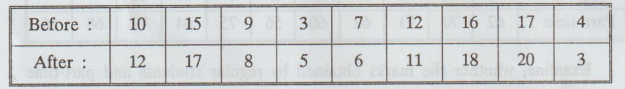
The
following are the average weekly losses of working hours due to accidents in 10
industrial plants before and after an introduction of a safety program was put
into operation.

Use
0.05 level of significance to test whether the safety program is effective.
Solution:

6.
Conclusion:
Here,
Cal t < table t
i.e.,
0.369 < 2.101
So,
we accept Ho at 5% level of significance.
Example
1.3b(5)
19diadw
test of 93050lingia lo laval 20.0 sa U The following random samples. are
measurements of the heat producing capacity (in millions of calories per ton)
of specimen's of coals from two mines.

Use
the 0.01 level of significance to test whether the difference between the means
of these two samples is significant. [A.U. N/D 2008]
Solution
:

6.
Conclusion:
Here,
Cal t > table t
i.e.,
4.19 > 3.25
So,
we reject H0
Example
1.3b(6) 9ft
Two
independent samples are chosen from two schools A and B, a common test is given
in a subject. The scores of the students as follows :

Can
we conclude that students of school A performed better than students of school
B? [A.U. A/M 2008]
Solution
:
H0
: There is no significant difference in the performance of students between
school A and school B.
H1
: The performance of students of school A is better than that of school
B.

6.
Conclusion:
Here,
Cal t < table t
i.e.,
0.173 < 1.771
So,
we accept Ho at 5% level of significance.
Example
1.3.b(7)
In
a certain experiment to compare two types of pig foods A and B, the following
results of increase in weights were observed in pigs :lol
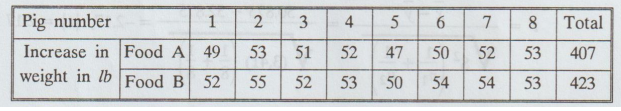
(i) Assuming that the two samples of pigs are
independent, can we conclude that food B is better than food A ?
(ii)
Also, examine the case when the same set of eight pigs were used in both the
foods.
Solution:
Given n1 = 8, n2 = 8

6.
Conclusion:
Here,
Cal t > table t
i.e.,
2.17 > 1.761
So,
we reject H0 at 5% level of significance.
Hence,
we conclude that the foods A and B differ significantly as regards their effect
on increase in weight, so food B is superior to food A.
(ii)
Paired t-test
If
the same set of pigs is used in both the cases, then the readings X and Y are
not independent but they are paired together and we apply the paired t-test for
testing H0.
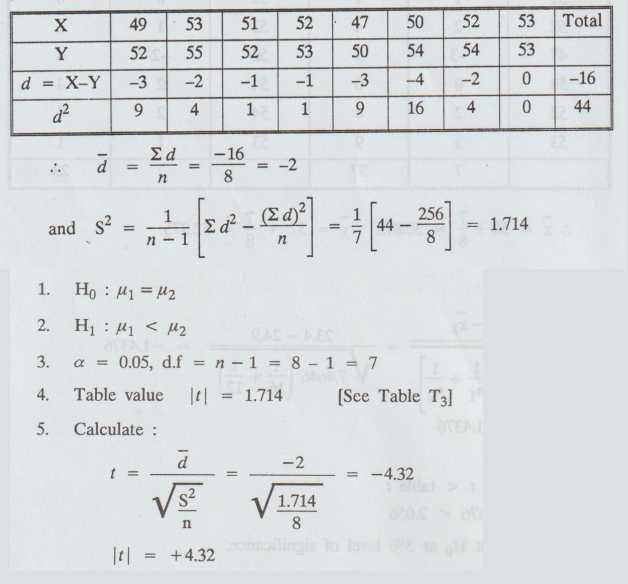
6.
Conclusion:
Here
Cal t > table t
i.e.,
4.32 > 1.714
So,
we reject H0 at 5% level of significance.
We
conclude that food B is superior to food A.
Example
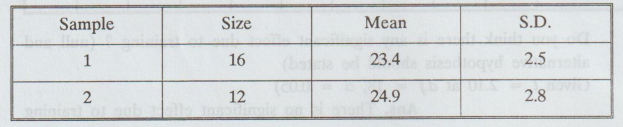
1.3.b(8)
The
independent samples from normal populations with equal variance gave the
following:

Is
the difference between the means significant? [A.U N/D 2019 (R-17)]
Solution :

6.
Conclusion :
Here
Cal t < table t
i.e.,
1.4376 < 2.056
So,
we accept H0 at 5% level of significance.
Example
1.3.b(9)
The
mean height and the S.D height of 8 randomly chosen soldiers are 166.9 cm and
8.29 cm respectively. The corresponding values of 6 randomly chosen sailors are
170.3 cm and 8.50 cm respectively. Based on this data, can we conclude that
solider's are, in general, shorter than sailors?
Solution
:

So,
we accept H0 at 5% level of significance.
i.e.,
based on the given data, we cannot conclude that soldiers are in general,
shorter than sailors.
Example
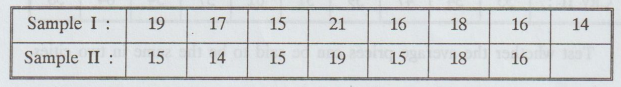
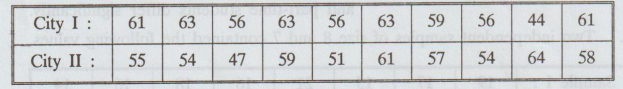
1.3.b(10)
Samples
of two types of electric bulbs were tested for length of life and the following
data were obtained.

If
the difference in the means sufficient to warrant that sample I bulbs are
superior to sample II bulbs?
Solution
:

6.
Conclusion :
Here,
Cal t > table t
i.e.,
9.39 > 1.771
So,
we reject H0
i.e.,
sample I bulbs may be regarded superior to sample II bulbs at 5% level of
significance.
EXERCISES 1.3(b)_
1.
Samples of two types of electric light bulbs were tested for length of life and
following data were obtained.

Is
the difference in the means sufficient to warrant that type I is superior to
type II regarding length of life.
Ans.
The two types I and II of electric bulbs are not identical
2.
The average number of articles produced by 2 machines per day are 200 and 250
with standard deviation 20 and 25 respectively, on the basis of records of 25
days production. Can you regard both the machines equally efficient at 1% level
of significance.
Ans.
The machine are not equally efficient at 1% level of significant
3.
Below are given the gain in weights (in lbs) of pigs fed on two diets A and B.
Test,
if the two diets differ significantly, as regards their effect on increase in
weight.
Ans.
There is no significant difference between the mean increase in weight due to
diets A and B.
4.
The heights of six randomly chosen sailors are in inches 63, 65, 68, 69, 71 and
72. Those of 10 randomly chosen soldiers are 61, 62, 65, 66, 69, 69, 70, 71, 72
and 73. Discuss the light that these data throw on the suggestion that sailors
are on the average taller than soldiers.
Ans.
The sailors are not on the average taller than the soldiers. [A.U
N/D 2014]
5.
Two sets of ten students selected at random from a college were taken: one
set was given memory test as they were, and the other was given the memory
test; after two weeks of training the scores are given below:

Do
you think there is any significant effect due to training? (null and
alternative hypothesis should be stated)
Given
t = 2.10 at df = 18, ɑ = 0.05)
Ans.
There is no significant effect due to training
6.
Values of a variate in two samples are given below :

Test
the significance of the difference between the two sample means.
Ans.
There is no significant difference between the population means.
7.
The marks obtained by a group of 9 regular course students and another group of
11 part-time course students in a test are given below :
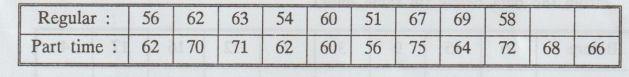
Examine,
whether the marks obtained by regular students and part-time students differ
significantly at 5% level of significance and 1% level of significance.
Ans.
The marks obtained by regular students and part-time students differ
significantly.
8.
Two independent samples of size 8 and 7 contained the following values.
Is
the difference between the sample means significant?
9.
Table gives the biological values of protein from cow's milk and buffalo's milk
at a certain level. Examine if the average values of protein in the two samples
significantly differ.

10.
Two independent samples from normal populations with equal variance gave the
following:
Is
the difference between the means significant?
11.
A group of five patients treated with medicine A, weight 42, 39, 48, 60, 41 kg;
a second group of 7 patients from the same hospital treated with medicine 'B'
weigh 38, 42, 56, 64, 68, 69, 62 kg. Do you agree with the claim that medicine
B increases the weight significantly?
12.
Memory capacity of 9 students was tested before and after a course of
meditation for a month. State whether the course was effective or not from the
data below (in same units)
13.
To compare the prices of a certain product in two cities, ten shops were
selected at random in each town. The prices was noted below:
Test
whether the average prices can be said to be the same in two cities.
Statistics and Numerical Methods: Unit I: Testing of Hypothesis : Tag: : Solved Example Problems | Testing of Hypothesis | Statistics - Small sample test for difference of means
Related Topics
Related Subjects
Statistics and Numerical Methods
MA3251 2nd Semester 2021 Regulation M2 Engineering Mathematics 2 | 2nd Semester Common to all Dept 2021 Regulation