Statistics and Numerical Methods: Unit I: Testing of Hypothesis
Small Sample Tests
Solved Example Problems | Testing of Hypothesis | Statistics
It is used to test the significance of the difference of the mean of a random sample and the mean of the population
SMALL SAMPLE TESTS
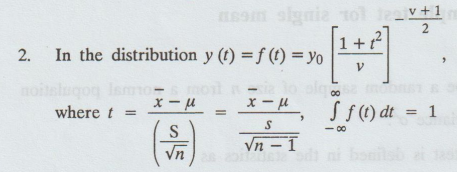
1. Small sample test for single mean
I.
Student's t
Let
x1, x2,...xn be a random sample of size n from
a normal population with mean μ and variance σ2 .
The
student's t test is defined in the statistics as
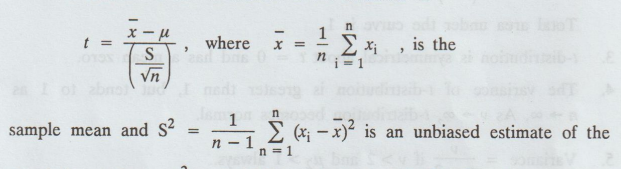
population
variance σ2 and t follows student's t-distribution with v = n – 1 degrees
of freedom with probability density function
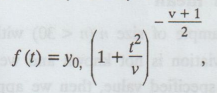
where
v = n − 1 and y0 is a constant determined by 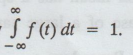
This
is known as 'student's t distribution' or t-distribution
Here,
v = n − 1 is called the number of degrees of freedom.
Note:
The range of t-distribution is - ∞ to ∞
II.
Uses and its applications [A.U N/D 2011]
1.
It is used to test the significance of the difference of the mean of a random
sample and the mean of the population
2.
It is used to test the significance of the difference between two sample means.
3.
To test the significance of an observed sample correlation coefficient and
sample regression coefficient.
4.
To test the significance of observed partial and multiple correlation
coefficients.
III.
Properties of t-distribution
1. The variable ranges from - ∞ to ∞
Total
area under the curve is 1.
3.
t-distribution is symmetrical about t = 0 and has a mean zero.
4.
The variance of t-distribution is greater than 1, but tends to 1 as n → ∞. As v
→ ∞, t - distribution becomes normal.
5.
Variance = ν / v – 2 if v > 2 and µ2 > 1 always.
Test
for a specified mean
Given
a random sample of size n (n < 30) with sample mean x and the population
standard deviation is not known and we want to test whether the population mean
has a specified value, then we apply the same procedure as in the case of a
large sample.
Working
Procedure :
For
the small samples (n < 30), σ known, decision is based on the t-distribution
with v = n - 1 degrees of freedom. di be bellso a
1.
Null hypothesis H0 : μ = μ0
2.
Alternative hypothesis H1: μ ≠ μ0 (or) µ > μ0
(or) μ < μ0
3.
Level of significance: ɑ
4.
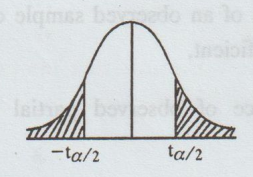
Critical region
(a)
If μ ≠ µ0, then the test is two-tailed test for the given ɑ.
The
critical values are –tɑ/2 and ta/2 from the tɑ/2 distribution
table with d.f. = n - 1
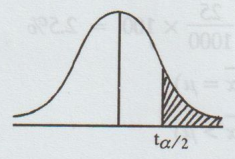
(b) If µ > µ0, then the test is
one-tail test (right) for the given ɑ
The
critical values is tɑ with d.f. = n - 1.
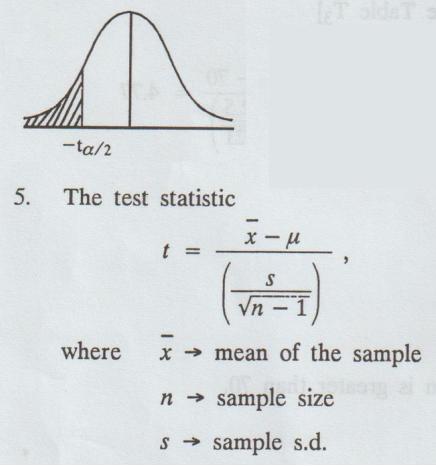
(c)
If µ < µ0, then the test is one-tailed test (left) for the given ɑ.
The
critical value is -ta with d.f = n - 1.
6.
Conclusion :
(a) If -t ɑ/2 < t < t ɑ/2 then we accept H0;
otherwise, add we reject H0
(b)
If t < tɑ, then accept H0, otherwise, we reject H0
(c)
If -ta < tɑ then accept H0, otherwise, we reject H0.
Example
1.3a (1).
Given
a sample mean of 83, a sample standard deviation of 12.5 and a sample size of
22, test the hypothesis that the value of the population mean is 70 against the
alternative that it is more than 70. Use the 0.025 significance level. [A.U A/M
2018 R-13] 2.5)
Solution
:
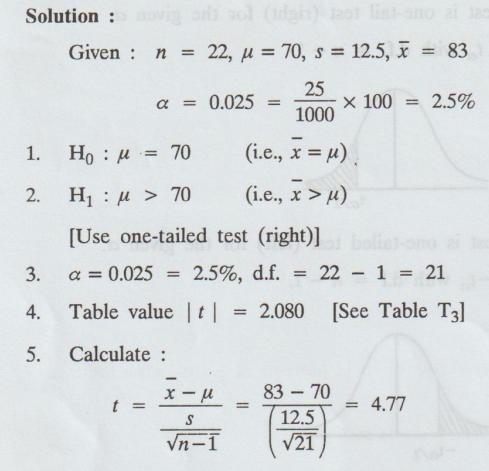
6.
Conclusion :
Here,
Cal t > table t
i.e., 4.77 > 2.08
So,
we reject H0
Mean
value of the population is greater than 70.
Example
1.3a (2).
A
machinist is making engine parts with axle diameters of 0.7 inch. A random
sample of 10 parts shows a mean diameter of 0.742 inch with a standard
deviation of 0.04 inch. Compute the statistic you would use to test, whether
the work is meeting the specification. [A.U M/J 2006] [A.U A/M 2019 R-13]
Solution:
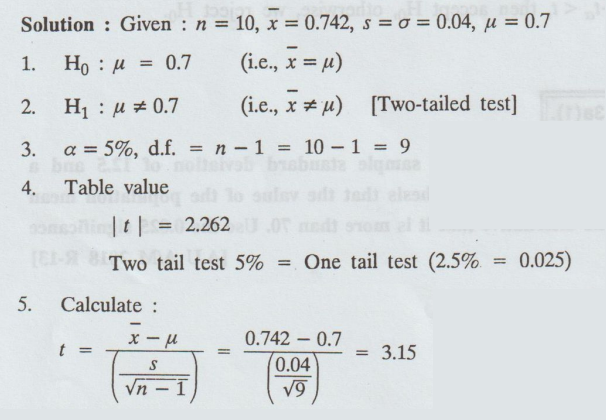
6.
Coonclusion :
Here,
Cal t > table t
i.e.,
3.15 > 2.262
So,
we reject H0
The
product is not conforming the specification.
Example
1.3a (3)
A
certain injection administered to each of 12 patients resulted in the following
increases of blood pressure :
5,
2, 8, -1, 3, 0, 6, -2, 1, 5, 0, 4
can
it be concluded that the injection will be, in general, accompanied by an
increase in B.P?
Solution:
Given:
n = 12
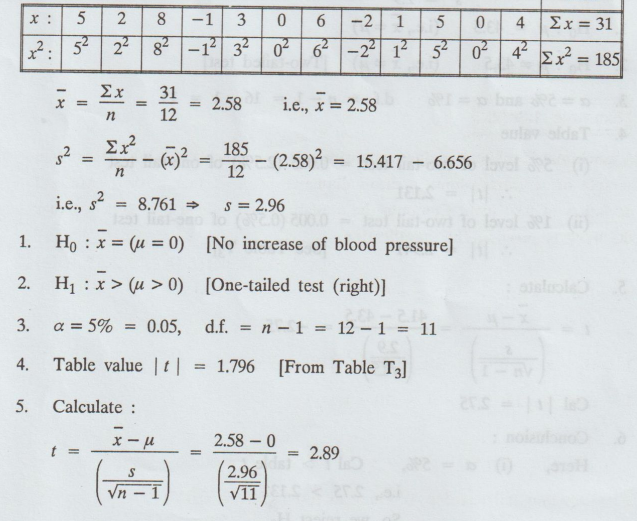
6.
Conclusion :
Here,
Cal t > table t
i.e.,
2.89 > 1.796
So,
we reject H0
noiaulono
i.e.,
we may conclude that the injection is accompanied by an increase in B.P.
Example
1.3.a(4)
A
random sample of 16 values from a normal population showed a mean of 41.5
inches and the sum of squares of deviations from this mean equal to 135 square
inches. Show that the assumption of a mean of 43.5 inches for the population is
not reasonable. Obtain 95 percent and 99 percent fiducial limits for the same.
Solution:
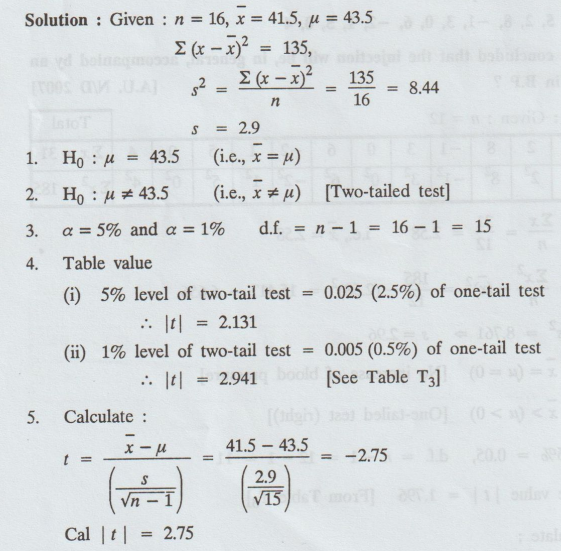
6.
Conclusion:
Here,
(i) ɑ = 5%, Cal t > table t
i.e.,
2.75 > 2.131
So,
we reject H0
(ii)
ɑ = 1%, Cal t < table t
i.e.,
2.75 < 2.941
So,
we accept H0
We
conclude that the assumption is reasonable.
7.
95% fiducial limits for µ: (d.f = 15)
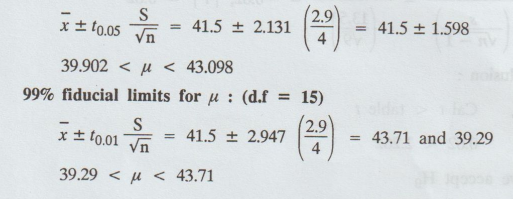
Example
1.3.a(5)
A
random sample of 10 boys had the following I.Q's: 70, 120, 110, 101, 88, 83,
95, 98, 107, 100. Do these data support the assumption of a population mean I.Q
of 100 ? Find a reasonable range in which most of the mean I.Q. values of
samples of 10 boys lie.s
Solution
:
[A.U
A/M 2015 R-8, N/D 2012 R-8, M/J 2016 R-13] T[A.U N/D 2017 R-13]
Given:
n = 10, μ = 100
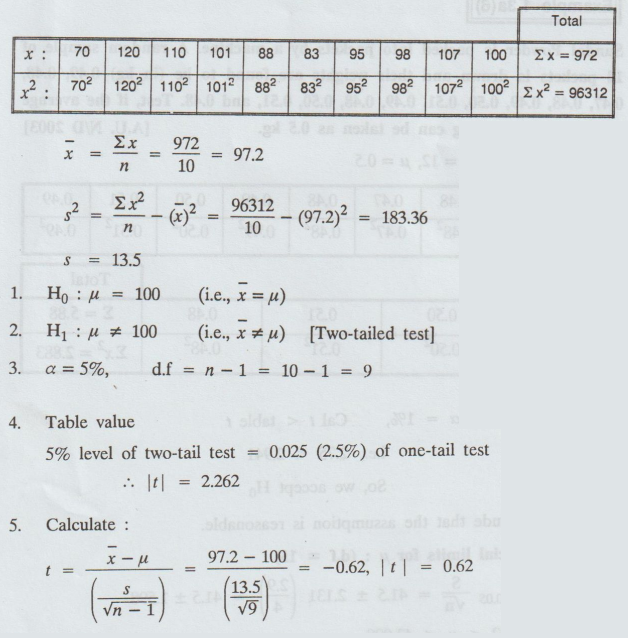
6.
Conclusion:
Here,
Cal t < table t
i.e.,
0.62 < 2.262
So,
we accept H0
We
may conclude that the data are consistent with the assumption of mean I.Q of 100
in the population.
95% confidence limits within which the mean
I.Q values of samples of 10 boys will lie is [87.55, 106.85]
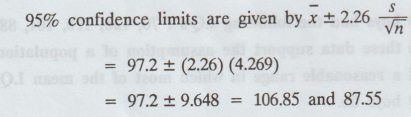
Example
1.3a (6)
Sandal
Powder is packed into packets by a machine. A random sample of 12 packets is
drawn and their weights are found to be (in kg) 0.49, 0.48, 0.47, 0.48, 0.49,
0.50, 0.51, 0.49, 0.48, 0.50, 0.51, and 0.48. Test, if the average weight of
the packing can be taken as 0.5 kg. [A.U. N/D 2003]
Solution:
Given:
n = 12, μ = 0.5
6.
Conclusion:
Here,
Cal t > table t
i.e.,
2.76 > 2.201
So,
we reject H0
The
average packing cannot be taken to be 0.5 kg.
Example
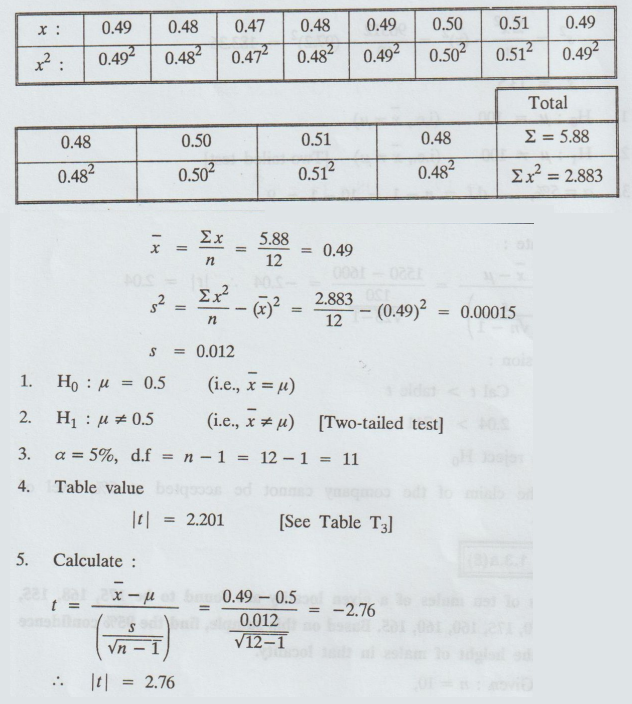
1.3a (7)
The
mean lifetime of a sample of 25 bulbs is found as 1550 hours with a S.D. of 120
hours. The company manufacturing the bulbs claims that the average life of
their bulbs is 1600 hours. Is the claim acceptable at 5% level of significance?
Solution:
6.
Conclusion:
Here
Cal t > table t
i.e.,
2.04 > 1.711
So,
we reject H0
i.e.,
The claim of the company cannot be accepted at 5% level of significance.
Example
1.3.a (8)
The
heights of ten males of a given locality are found to be 175, 168, 155, 170,
152, 170, 175, 160, 160, 165. Based on this sample, find the 95% confidence
limits for the height of males in that locality.
Solution:
Given: n = 10,
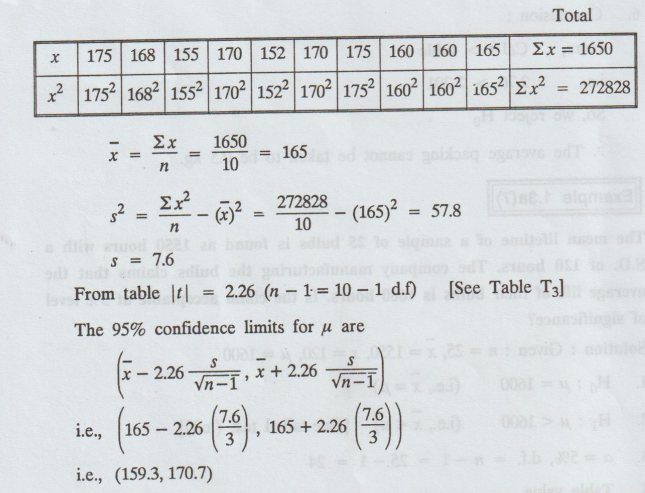
i.e.,
the heights of males in the locality are likely to lie within 159.3 cm and
170.7 cm
Example
1.3.a (9)
A
machinist is expected to make engine parts with axle diameter of 1.75cm. A
random sample of 10 parts shows a mean diameter 1.85 cm with a s.d. of 0.1 cm.
On the basis of this sample, would you say that the work of the [ET olds: 502]
aulay oldsT machinist is inferior?
Solution:
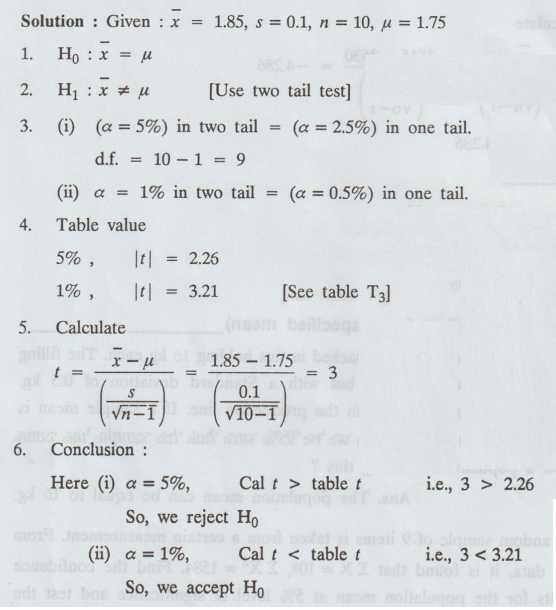
Example
1.3.a(10)
A
test of the breaking strengths of 6 ropes manufactured by a company showed a
mean breaking strength of 3515 kg and a standard deviation of 60 kg, whereas
the manufacturer claimed a mean breaking strength of 3630 kg. Can we support
the manufacturer's claim at a level of significance 0.05. vob bisbrisja [A.U.
N/D 2020 (R17), A/M 2020 (R17), A/M 2019 (R17)] @ 10] 1 lo sulsV nonsivabad lo
lo so
Solution
:
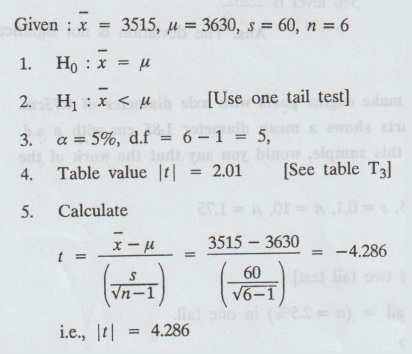
6.
Conclusion :
Here
Cal t > table t
i.e.,
4.286 > 2.01
So,
we reject H0
EXERCISE 1.3(a) (Test for a specified mean),
1.
Certain refined edible oil is packed in tins holding 16 kg each. The filling
machine can maintain this, but with a Standard deviation of 0.5 kg. Samples of
25 are taken from the production line. If a sample mean is (i) 16.35 kg (ii)
15.8 kg, can we be 95% sure that the sample has come from a population of 16 kg
tins ?
Ans.
The population mean can be equal to 16 kg.
2.
A random sample of 9 items is taken from a certain measurement. From the data,
it is found that Σ X = 108, Σ X2 = 1584. Find the confidence limits
for the population mean at 5% level of significance and test the alue of t at
5% level hypothesis that the population mean is 8. Table value of t at 5% level
for 8 d.f and 9 d.f are respectively 2.306 and 2.226.
Ans.
The population mean is 8 is valid.
3.
A machine is designed to produce insulating washers for electrical devices of
average thickness of 0.025 cm. A random sample of 10 washers was found to have
an average thickness of 0.024 cm with a standard deviation of 0.002 cm. Test
the significance of the deviation. Value of t for 9 degrees of freedom at 5% level
is 2.262.
Ans.
The deviation is not significant.
4.
A
company has been producing steel tubes of mean inner diameter of 2.00 cm. A
sample of 10 tubes gives an inner diameter of 2.01 cm and a variance of 0.004
cm2. Is the difference in the value of mean significant ?
Value
of t for 9 d.f at 5% level = 2.262.
Ans.
The means of the population and the sample are not significant.
5.
A filling machine is expected to fill 5 kg of powder into bags. A sample of 10
bags gave the weights 4.7, 4.9, 5.0, 5.1, 5.4, 5.2, 4.6, 5.1, 4.6 and 14.7.
Test
Ans.
The machine is working properly.
6.
Eight individuals are chosen at random from a population and then, heights are
found to be in cms. 163, 163, 164, 165, 166, 169, 170, 171. In the light of
these data, discuss the suggestion that the mean height diw in the universe in
165 cms.
Ans.
The mean height can be regarded as 165 cms.
7.
Ten students are selected at random from a college and then heights are found
to be 100, 104, 106, 110, 118, 120, 122, 124, 126 and 128 cms. In the light of
these data, discuss the suggestio.. that the mean height of the students of the
college is 110 cm. The table value of t at 5% level for 8 d.f is 2.306 and for
9 d.f is 2.262 and 10 d.f is 2.228 for a two-tail test.
Ans.
The mean height of the population can be regarded as 110 cms.
8.
A fertilizer mixing machine is set to give 12 kg of nitrate for every quintal
bag of fertilizer. Ten 100 kg bags are examined and percentage of nitrate is as
follows :
11,
14, 13, 12, 13, 12, 13, 14, 11, 12
Is
there reason to believe that the machine is defective?
Ans.
The machine is not defective
9. The heights of 10 males of a given locality are found to be 175, 168, 155, 170, 152, 170, 175, 160, 160 and 165 cms. Based on this sample of 10 items, test the hypothesis that the mean height of males is 170 cms.
Ans. The mean height of
males can be regarded as 170 cms.
10.
The mean weekly sales of a powder in supermarket was 146.3 tins. After a
special advertising campaign the mean weekly sales in 22 branches in a week
increased to 153.7 tins and showed a S.D. 17.2 tins. Was the advertising
campaign successful?
11.
The nine items of a sample have the following values: 45, 47, 50, 52, 48, 47,
49, 53, 51. Does the mean of these values differ significantly from the assumed
mean 47.5? [for v = 8, t0.05 = 2.31]
12.
A spare parts manufacturer is making spare parts with axle diameter of 0.700
inch. A random sample of 10 parts shown a mean diameter of 0.742 inch with a
S.D of 0.040 inch. Verify whether the work satisfies the specifications.
13.
A sample of 20 items has mean 42 units and S.D 5 units. Test the hypothesis that
it is a random sample from a normal population with mean 45 units.
14.
The following results are obtained from a sample of 10 boxes of biscuits.
Mean
weight content = 490 gm
S.D.
of weight = 9 gm
rigio
Could the sample come from a population having a mean of 500 gm?
15.
The average breaking strength of steel rods is specified, to be 17.5 (in units
of 1000 kg). To test this, sample of 14 rods tested and gave the following
results: 15, 18, 16, 21, 19, 21, 17, 17, 15, 17, 20, 19, 17, 18. Is the result
of the experiment significant? Also obtain 95% confidence Istni A interval for
the average breaking strength?
Statistics and Numerical Methods: Unit I: Testing of Hypothesis : Tag: : Solved Example Problems | Testing of Hypothesis | Statistics - Small Sample Tests
Related Topics
Related Subjects
Statistics and Numerical Methods
MA3251 2nd Semester 2021 Regulation M2 Engineering Mathematics 2 | 2nd Semester Common to all Dept 2021 Regulation