Statistics and Numerical Methods: Unit I: Testing of Hypothesis
Two Marks Questions and Answers
Testing of Hypothesis | Statistics
Statistics and Numerical Methods : Unit - 1 : Testing of Hypothesis : Statistics and Numerical Methods : '2' Marks Questions and Answers
UNIT - I
TESTING OF HYPOTHESIS
'2' Marks Questions and Answers
1.
Write down any two properties of x2-distribution [A.U CBT N/D 2010]
Solution:
Properties: 0 251
1.
Moment generating function of x2-distribution is (1-2t)-v/2
2.
The sum of the independent chi-square variables is also a chi-square variable.
3.
x2 -distribution tends to normal as n → ∞
4.
The number of independent variables is usually called the number of degrees of
freedom.
5.
For p × q contingency table, degrees of freedom is (p-1) (q - 1)
2.
What is sampling distribution? [A.U CBT N/D 2010] [A.U
A/M 2018 R-8]
From
a population a number of samples are drawn of equal size n. Find out the mean
of each sample. The means of samples are not equal. The means with their
respective frequencies are grouped.
The
frequency distribution so formed is known as sampling distribution of the mean,
similarly, sampling distribution of standard deviation we can have.
3.
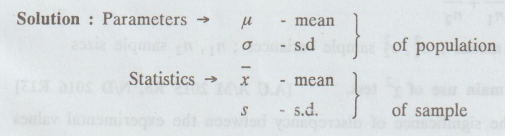
What are the parameters and statistics in sampling ? [A.U
N/D 2011]
Solution:
4.
Mention the various steps involved in testing of hypothesis.
[A.U A/M 2010] [A.U N/D 2019 R-13]
Solution
:
(i)
Set up a null hypothesis H0,
(ii) Set up the alternative hypothesis H1,
(iii)
Select the appropriate level of significance (ɑ),
(iv)
Compute the test statistic z = t-E (t) / SE (t) under H0,
(v)
We compare the "calculate z" with "critical value za"
at given level of significance (ɑ)
5.
Define x2-test of goodness of fit. [A.U
A/M 2010 R-8]
Chi
square test of goodness of fit is a test to find if the deviation of the
experiment from theory is just by chance or it is due to the inadequacy of the
theory to fit the observed data. By this test, we test whether differences
between observed and expected frequencies are significant or not.
Chi-square
test statistic of goodness of fit is defined by x2 = Σ (O –
E)2 / E where O is the observed frequency
6.
Define student's t-test for difference of means of two samples.
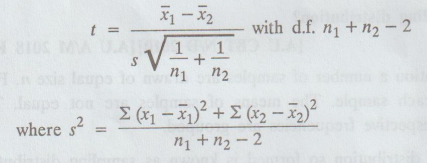
7.
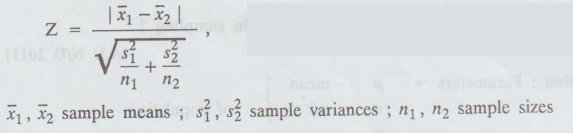
Write down the formula of test statistic 't' to test the significance of
difference between the means (large samples). [A.U A/M 2015
R-13, N/D 2016 R-13]
8.
Give the main use of x2 test. [A.U A/M 2015 R8, N/D 2016 R13]
1.
To test the significance of discrepancy between the experimental values and the
theoretical values, obtained under some theory or hypothesis.
2.
With the help of x2-test, we can find out whether two or more
attributes are associated or not.
9.
Write the condition for the application of x2 -test. [A.U
A/M 2017 R-8, M/J 2014 R-8, A/M 2011 R-8]
(i)
The sample observations should be independent.
(ii)
Constraints on the cell frequencies, if any, must be linear.
(iii)
N, the total frequency, should be atleast 50.
(iv)
No theoretical cell frequency should be less than 5
10.
What is the assumption of t-test ? [A.U A/M 2018 R-08]
(i)
The parent population from which sample is drawn is normal.
(ii)
The sample observation are independent are that is sample random.
(iii)
The population standard deviation σ is unknown.
(iv)
Sample size n < 30.
11.
What do you mean by test of Hypothesis two-tailed test ?
A
test of any statistical hypothesis where the alternative hypothesis is two
tailed, is called two-tailed test.
Example
: H0 : μ = μ0
H1
: μ ≠ μ0
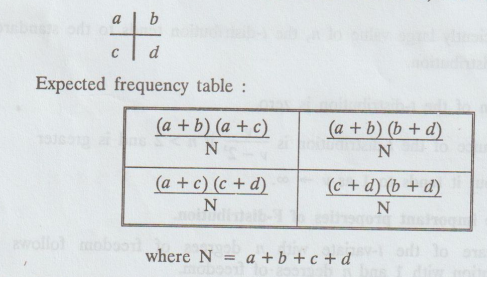
12.
What are the expected frequencies of 2 × 2 contingency table given below.
[A.U
A/M 2015 R-13, A.U A/M 2017 R-13]
13.
Student 't'-distribution is used to test
(or) What are the applications of t-distribution? [A.U
A/M 2011 R-8]
1.
To test the significance of the difference of the mean of a random sample and
the mean of the population
2.
To test the significance of the difference between two sample means.
14.
Explain Null Hypothesis.
For
applying the tests of significance we first set up a hypothesis which is a
define statement about the population parameter.
Usually,
such a hypothesis is a hypothesis of no difference and it is denoted by H0
15.
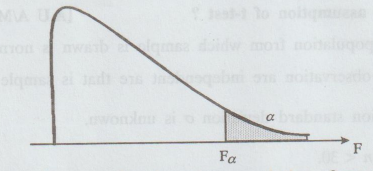
Draw the rough sketch of F-distribution.
16.
If two samples are taken from two population of unequal variances can we apply
t-test to test the difference of mean.
We
can not apply t-test because the assumptions of population variances bolist-c
baitso ai belist ow are equal and unknown.
17.
State the important properties of 't'-distribution.
1.
The probability curve of the t-distribution is similar to the standard normal
wols curve and is symmetric about t = 0, bell-shaped and asymptotic to the
t-axis.
2.
For sufficiently large value of n, the t-distribution tends to the standard
normal distribution.
3.
The mean of the t-distribution is zero.
4.
The variance of the t-distribution is V / V – 2 if n > 2 and is greater than
1, but it tends to 1 as v → ∞.
18.
State the important properties of F-distribution.
1.
The square of the t-variate with n degrees of freedom follows a F-distribution
with 1 and n degrees of freedom.
2.
The mean of the F-distribution is V2 / V2 – 2 , (v2
> 2)
3.
The variance of the F-distribution is
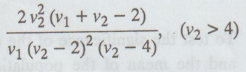
19.
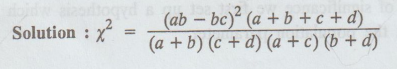
Give the formula for the x2-test of independence for
20.
What are Type-I and Type-II errors? [(CIS) 10 ([A.U M/J 2014 R8, N/D 2013 R8,
A/M 2011 R8, M/J 2012 R8] [A.U A/M 2019 R17, N/D 2019 R17, R13]
Solution
Type
I Error : Rejecting H0 when it is true.
Type
II Error: Accepting H0 when it is false.
21.
Give two applications of x2 test. [A.U N/D 2017 R13] [A.U N/D
2010 R8, M/J 2012 R8] [A.U. May 2000, N/D 2006, A/M 2008, M/J 2010, M/J 2012]
Solution
:
1.
To test the goodness of fit.
2.
To test the independent of attributes
3.
To test the homogeneous of independent estimations.
4.
The population variance... etc.
22.
Define the following terms: Statistic, parameter, standard error and
Random
sampling. [A.U A/M 2018
R-13] [A.U A/M 2018 R-8]
Solution
:
Statistic
: Measure describing the characteristic of sample.
Parameter
: Values that describe the character tic of population.
Standard
error : S.D of the sampling distribution of a statistic.
Random
sampling : A method of selecting a sample from a population in which all the
items in the population have an equal chance of being chosen in the sample.
23.
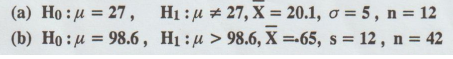
For the following cases, specify which probability distribution to use in a
hypothesis test. [A.U A/M 2018 R-13]
Solution
:
(a)
Normal distribution: Since σ is given.
(b)
t-distribution with d.f = 41
24.
Define the terms sample size and sampling error in random sampling. [A.U N/D
2019 (R17)]
Solution
:
Sample
size: A finite subset of statistical individuals in a
population is called a sample and the number of individuals in a sample is
called the sample size.
Sample
error: For the purpose of determining population
characteristics, the individuals in the sample are observed. On examining the
sample of a particular stuff we arrive at a decision of purchasing or rejecting
that stuff. The error involved in such approximation is known as sampling
error.
25.
Write any two characteristics of x2 test. [A.U
A/M 2019 (R13)]
Solution:
1.
This test is based on frequencies and not on the parameters like mean and s.d.
2.
The test is used for testing the hypothesis and is not useful for estimation.
3.
This test can also be applied to a complex contigency table with several classes
and as such is very useful test in research work.
Statistics and Numerical Methods: Unit I: Testing of Hypothesis : Tag: : Testing of Hypothesis | Statistics - Two Marks Questions and Answers
Related Topics
Related Subjects
Statistics and Numerical Methods
MA3251 2nd Semester 2021 Regulation M2 Engineering Mathematics 2 | 2nd Semester Common to all Dept 2021 Regulation