Statistics and Numerical Methods: Unit I: Testing of Hypothesis
x2-test to test the independence of attributes
Solved Example Problems | Testing of Hypothesis | Statistics
Let us consider two attributes A and B. A divided in r classes A1, A2, ... A, and B divided into S classes B1, B2, ... Bs. If this is expressed as r × s matrix, the matrix is called r × s contingency table.
c. x2-test
to test the independence of attributes
Let
us consider two attributes A and B. A divided in r classes A1, A2,
... A, and B divided into S classes B1, B2, ... Bs.
If this is expressed as r × s matrix, the matrix is called r × s contingency
table.
If
(Ai), (Bj) represent the number of persons possessing the
attribute Ai, and Bj respectively (i 1, 2, ..., r, j = 1,
2, .... s) and (Ai Bj) represents the number of persons
possessing attributes Ai and Bj.
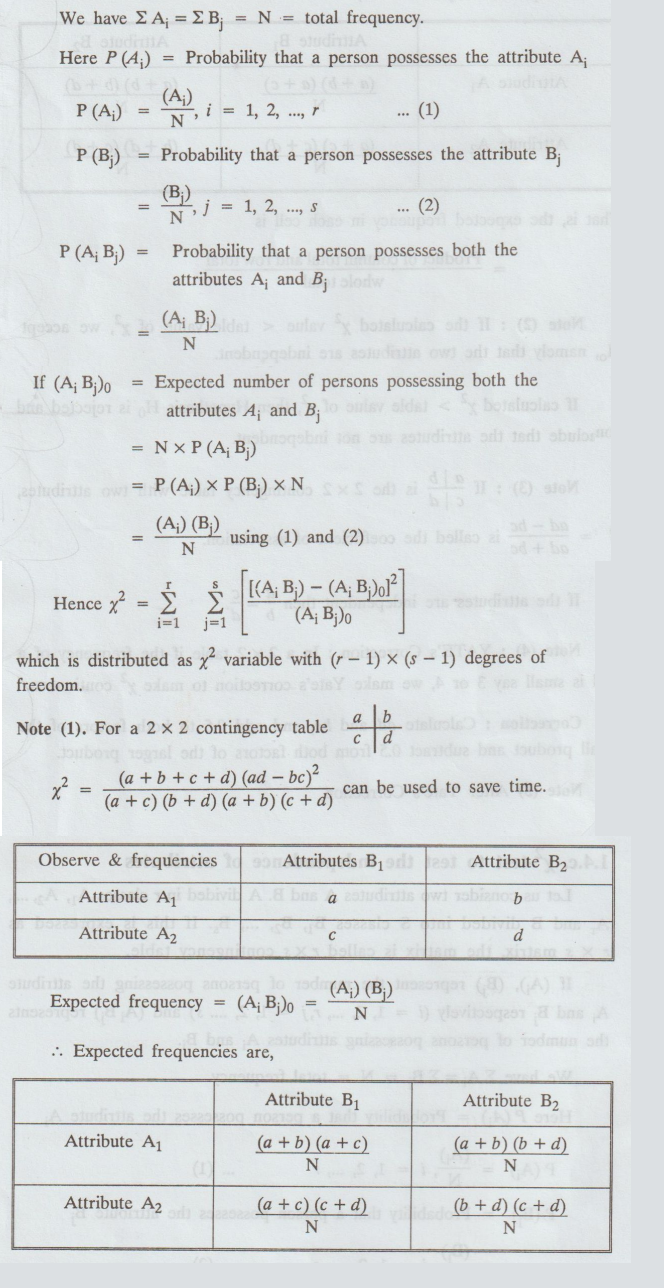
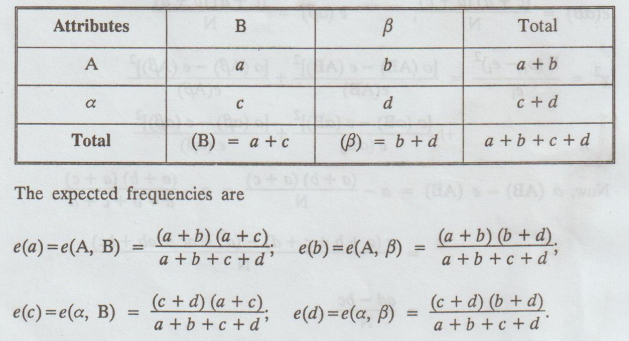
That
is, the expected frequency in each cell is
=
Product of column total and row total / whole total
Note
(2):
If the calculated x2 value <table value of x2,
we accept Ho, namely that the two attributes are independent.
If
calculated x2 > table value of x2, then
Hypothesis H0 is rejected and conclude that the attributes are not
independent.
Note
(3):
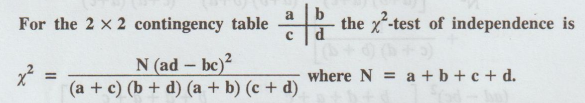
If a | b / c | d is the 2 × 2 contingency table with two attributes,
O
= ad – bc / ad + bc is called the coefficient of association.
If
the attributes are independent then a / b = c / d.
Note
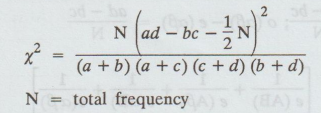
(4) :
YATE's Correction: In a 2 × 2 table if the frequency of a cell is small say 3
or 4, we make Yate's correction to make x2 continuous.
Correction:
Calculate ad and bc, and add 0.5 to both factors of the small product and
subtract 0.5 from both factors of the larger product.
Note
(5)
After Yate's Correction,
Example
1.4.c.(1)
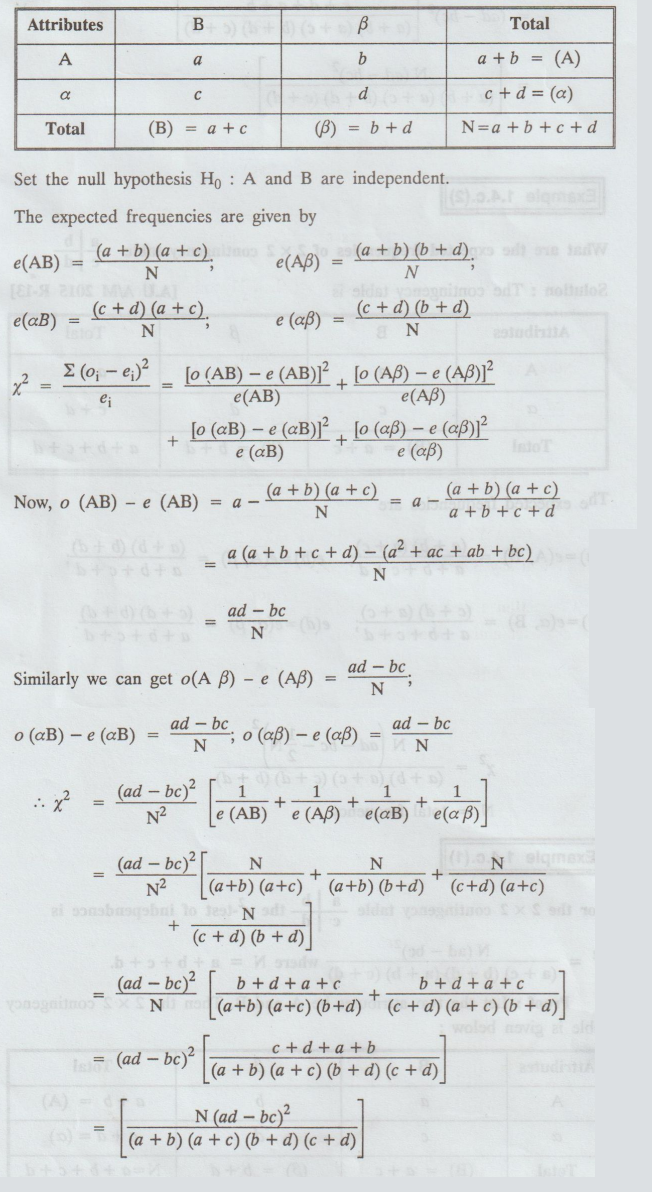
Proof:
Let the two attributes be A and B. Then the 2 × 2 contingency table is given
below :
Example
1.4.c.(2)
What
are the expected frequencies of 2 × 2 contingency table 
Solution:
The contingency table is [A.U A/M 2015 R-13]
Example
1.4.c. (3)
Find
if there is any association between extravagance in fathers and extravagance in
sons from the following data.
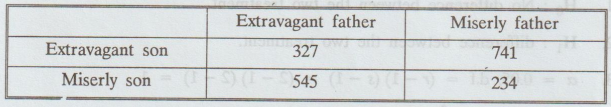
Determine
the coefficient of association also.
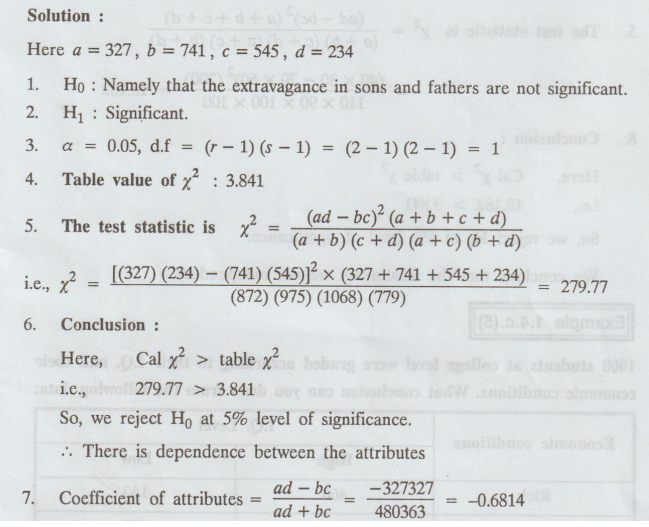
Solution
:
Example
1.4.c. (4)
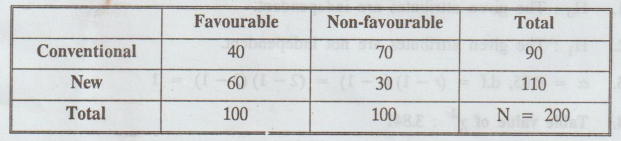
On
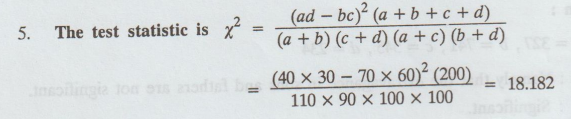
the basis of information noted below, find out whether the new treatment is
comparatively superior to the conventional one.
Solution
:
Here
É‘ = 40, b = 70, c = 60, d = 30
a
+ b + c + d = 200
1.
H0 : No difference between the two treatment.
2.
H1 : difference between the two treatment.
3.
α = 0.05, d.f = (r - 1) (s - 1) = (2-1)
(2-1) = 1
4.
Table value of x2: 3.841
6.
Conclusion :
Here,
Cal x2 > table x2
i.e.,
18.182 > 3.841
So,
we reject H0 at 5% level of significance.
We
conclude that the treatments are not independent.
Example
1.4.c.(5)
1000
students at college level were graded according to their I.Q. and their
economic conditions. What conclusion can you draw from the following data:
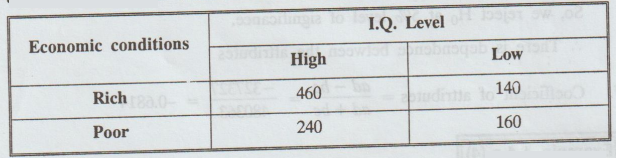
Solution
:
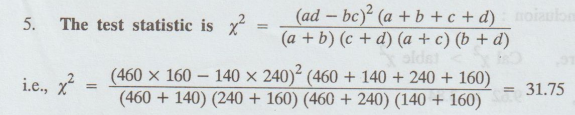
Here
É‘ = 460, b = 140, c = 240, d = 160
1.
H0 : The given attributes are
independent.
2.
H1 : The given attributes are not independent.
3.
α = 0.05, d.f = (r – 1) (s – 1) = (2 – 1 ) ( 2 – 1 ) = 1
4.
Table value of x2: 3.841
6.
Conclusion :
Here,
Cal x2 > table x2
i.e.,
= 31.75 > 3.841
So,
we reject Ho at 5% level of significance.
We
conclude that the attributes I.Q. as Economic conditions are not independent.
Example
1.4.c. (6)
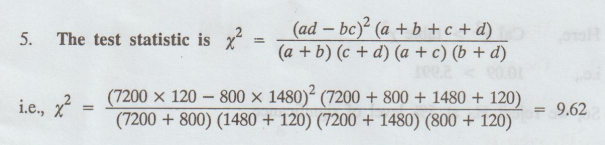
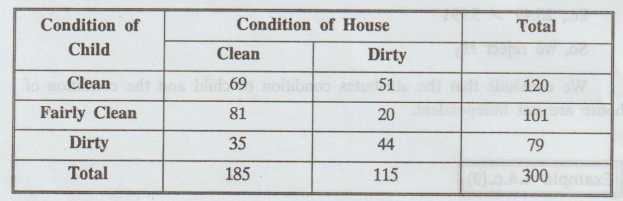
Out
of 8000 graduates in a town 800 are females, out of 1600 graduate 0001 employees
120 are females. Use x2 to determine if any distinction is
made in appointment on the basis of sex. Value of x2 at 5%
level for one degree of freedom is 3.84. [A.U A/M 2010]
Solution:
Given:
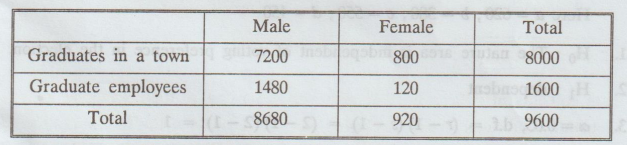
Here
a = 7200, b = 800, c = 1480, d = 120
1.
H0 : There is no significant difference between male and female.
2.
H1 There is significant difference between male and female.
3.
α = 0.05, d.f= (r− 1) (s - 1) = (2-1) (2 − 1) = 1
4.
Table value of x2: 3.84
6.
Conclusion:
Here,
Cal x2 > table x2
i.e.,
9.62 > 3.840
So,
we reject H0 at 5% level of significance.
Example
1.4.c. (7)
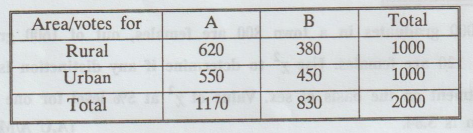
Two
sample polls of votes for two candidates A and B for a public office are taken
one one from among res among residents of rural areas. The results are given
below. Examine whether the nature of the area is related to voting preference in
this election. [A.U N/D 2011]
Solution
:
Here
a = 620, b = 380, c = 550, d = 450
1.
H0 : The nature area is independent of voting preference in the
election.
2.
H1: dependent
3.
α = 0.05, d.f = (r − 1) (s − 1) = (2-1) (2 − 1) = 1
4.
Table value of x2 : 5.991
6.
Conclusion :
Here,
Cal x2 > table x2
i.e.,
10.09 > 5.991
So,
we reject Ho at 5% level of significance.
Example
1.4.c.(8)
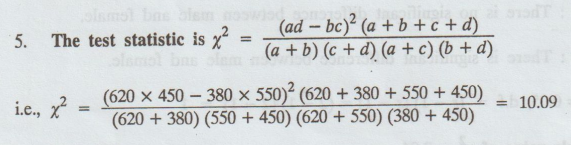
From
the following information state whether the condition of the child is
associated with the condition of the House.
Solution
:
1.
H0 : The given attributes are independent.
2.
H1: The given attributes are not independent.
3.
α = 0.05, d.f = (r-1) (s1) = (3 - 1) (2 - 1) = 2
4.
Table value of x2: 5.991
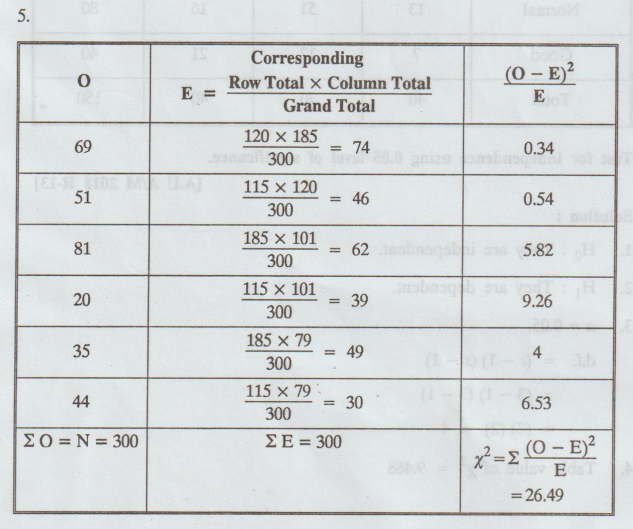
Cal
x2 = 26.49
6.
Conclusion:
Here,
Cal x2 > table x2
i.e.,
26.49 > 5.991
So,
we reject H0
We
conclude that the attributes condition of child and the condition of house are
not independent.
Example
1.4.c. (9)
Mechanical
engineers testing a new era welding technique, classified welds both with
respect to appearance and an X-ray inspection.
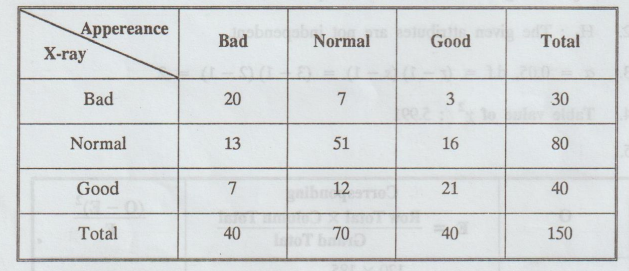
Test
for independence using 0.05 level of significance. [A.U A/M 2018 R-13]
Solution
:
1.
H0 : They are independent.
2.
H1 : They are dependent.
3.
α = 0.05,
d.f.
= (r − 1) (s - 1)
=
(3-1) (3-1)
=
(2) (2) = 4
4.
Table value of x2 = 9.488
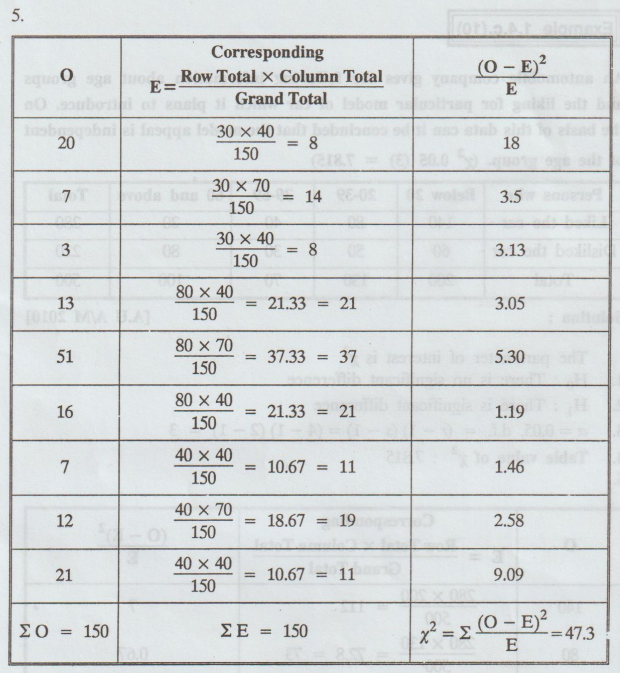
Converting
Ei's into whole number such that ΣE = ΣO
6.
Conclusion:
Cal
x2 > table x2
47.86
> 9.488, So we reject the null hypothesis.
X-ray
and Appearance are dependent.
Example
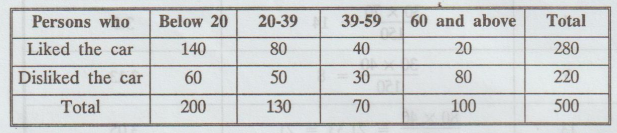
1.4.c.(10)
An
automobile company gives the following information about age groups and the
liking for particular model of car which it plans to introduce. On the basis of
this data can it be concluded that the model appeal is independent of the age
group. (x2.05 (3) = 7.815) [A.U A/M 2010]
Solution
:
The
parameter of interest is x2
1.
H0 There is no significant difference
2.
H1 There is significant difference
3.
ɑ = 0.05, d.f. = (r-1) (s-1) = (41) (2 − 1) = 3
4.
Table value of x2 : 7.815
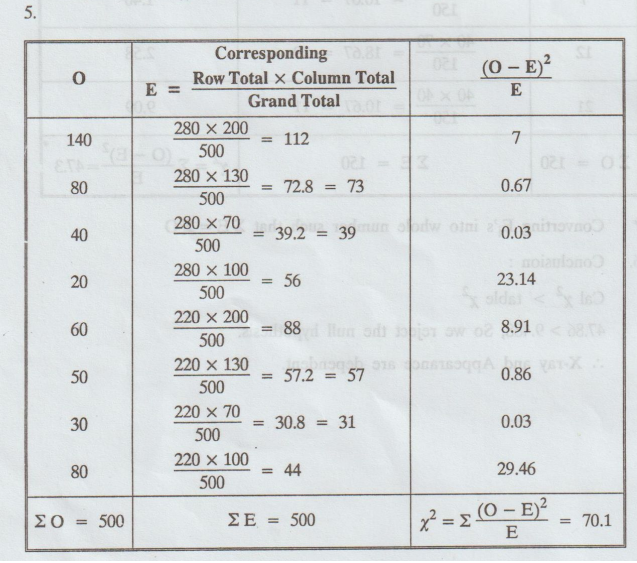
Converting
Ei's into whole number such that ΣE = Σ O
6.
Conclusion:
Here
Cal x2 > table x2
i.e.,
70.1 > 7.815
So,
we reject H0 at 5% level of significance.
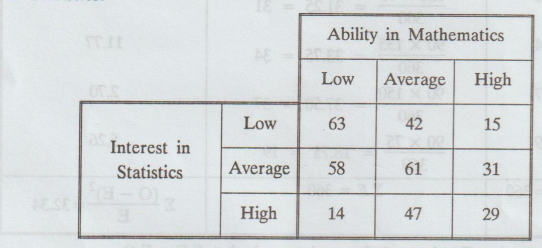
Example
1.4.c. (11)
Using
the data given in the following table to test at 1% level of significance
whether a person's ability in Mathematics is independent of his/her interest in
Statistics. [A.U N/D 2017 R-13]
Solution:
The
parameter of interest is x2
1.
H0 : Ability in mathematics and interest in statistics are
independent
2.
H1 : Ability in mathematics and interest in statistics are not independent
3.
a = 0.01,
d.f
= (r - 1) (s - 1)
=
(3-1) (3-1)
=
4
4.
Table value of x2 = 13.277
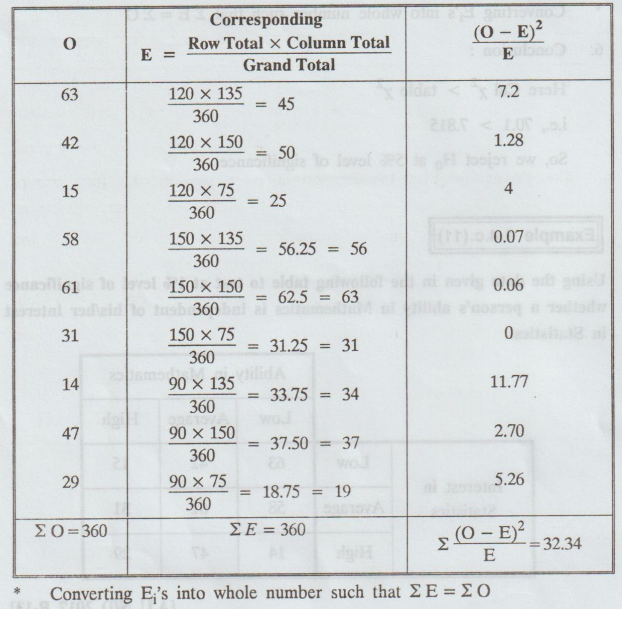
6.
Conclusion :
Here,
Cal x2 > table x2
i.e.,
32.34 > 13.277
So,
we reject H0 at 1% level of significance.
EXERCISES 1.4(c).
1.
The chi-square value of 2 × 2 table 
2.
If A, B are two independent attributes and if (A) = 36 (B) = 25 and N = 100
find (AB).
[Hint. (AB) = (A) / N = (B) 36 × 25 / 100 = 9]
3.
200 digits were chosen at random from a set of table. The frequencies of the
digits are:
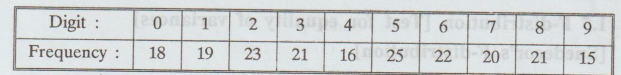
Use
x2 test to assess the correctness of the hypothesis that the
digits were distributed in equal numbers in the tables from which these numbers
were taken. 200
[Ans.
x2 = 4.3 Ho is accepted]
4.
The theory predicts the proportion of beans, in the four groups bas G1, G2, G3,
G4 should be in the ratio 9: 33: 1. In an experiment, with 1600 beans the
numbers in the four groups were 882, 313, 287 and 118. Does the experimental
result support the theory.
[Ans. Supports the theory x2
= 4.7266]
5.
A die is thrown 276 times and the results of these throws are given below :
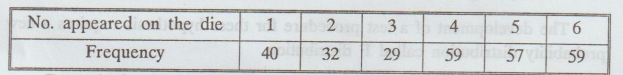
Test
whether the die is biased or not.
6.
A die is thrown 264 times and the results are given below :
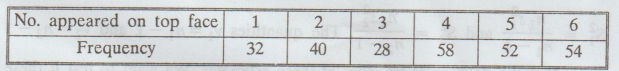
Show
that the die is biased.
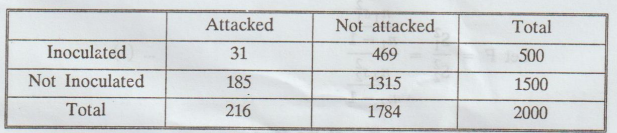
7.
The table given below shows the data obtained during an epidemic of cholera.
Test the effectiveness of inoculation in preventing the attack of cholera.
8.
In a certain sample of 2000 families 1400 people are consumers of tea. Out of
1800 Hindu families 1236 families consume tea. Use x2-test and state whether
there is any significant difference in consumption of tea among Hindu and
Non-Hindu families.
9.
From the data given below compare the association between literacy and
unemployment among males using x2 - test. Total 250; Literate
100; Unemployed 50; Literate and unemployed 30.
Statistics and Numerical Methods: Unit I: Testing of Hypothesis : Tag: : Solved Example Problems | Testing of Hypothesis | Statistics - x2-test to test the independence of attributes
Related Topics
Related Subjects
Statistics and Numerical Methods
MA3251 2nd Semester 2021 Regulation M2 Engineering Mathematics 2 | 2nd Semester Common to all Dept 2021 Regulation